Historical Price Return Distribution Report

A price return distribution can be an extremely useful tool to traders to help quickly access a stocks potential risks and returns over a set time period. The performance of a stock can be viewed on a historical basis isolating the frequency of returns positive/negative over a selected time interval.

Helps Stock Traders

  • Generate historical probabilities of positive and negative returns over different time intervals (daily, weekly, rolling 3 days, etc.)
  • Frequency of extreme moves
  • Set intervals for frequency of returns in a histogram

Helps Options Traders

  • Assessing option premium (expensive/cheap) by comparing implied moves with historical moves in a given time frame.
  • Historical probabilities of a stock price finishing below or above certain strike (return from spot)

How to find it?

From the main menu go to Stocks > Historical Price Return Distribution (or Click Here)

How to use it?

  1. Enter Symbol
  2. Select Time Interval for return (Daily, Weekly, etc.)
  3. Enter Years of Hist Prices
  4. Click the "Get Results" button to view the results

The screenshot below shows the inputs for IWM daily returns over a 2 year history.

Example of inputs for historical price return distributions.


The screenshot below shows the results for insights for IWM daily returns over a 2 year history.

Example of insights for historical price return distributions.


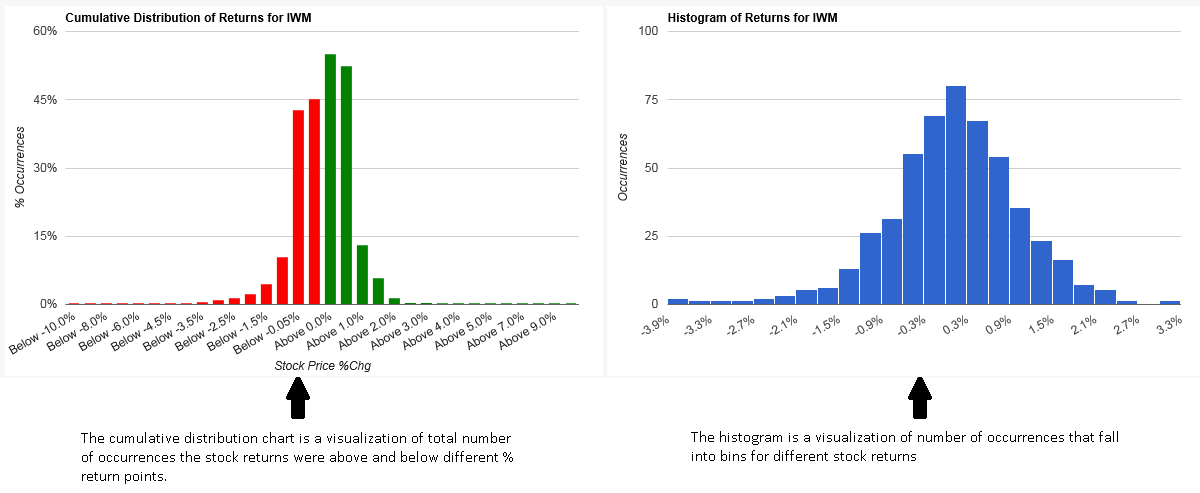
The screenshot below shows the two distribution charts you will see below the insights.

Example charts for historical price return distributions.

This example shows that extreme moves in IWM were ±2% with positive gains of 2% or more happening 1.4% of the time while negative returns -2% and below happening 2.2% over the 2 year history.


Using the Quick Check Feature

Example of a quick check on the historical price return distribution page

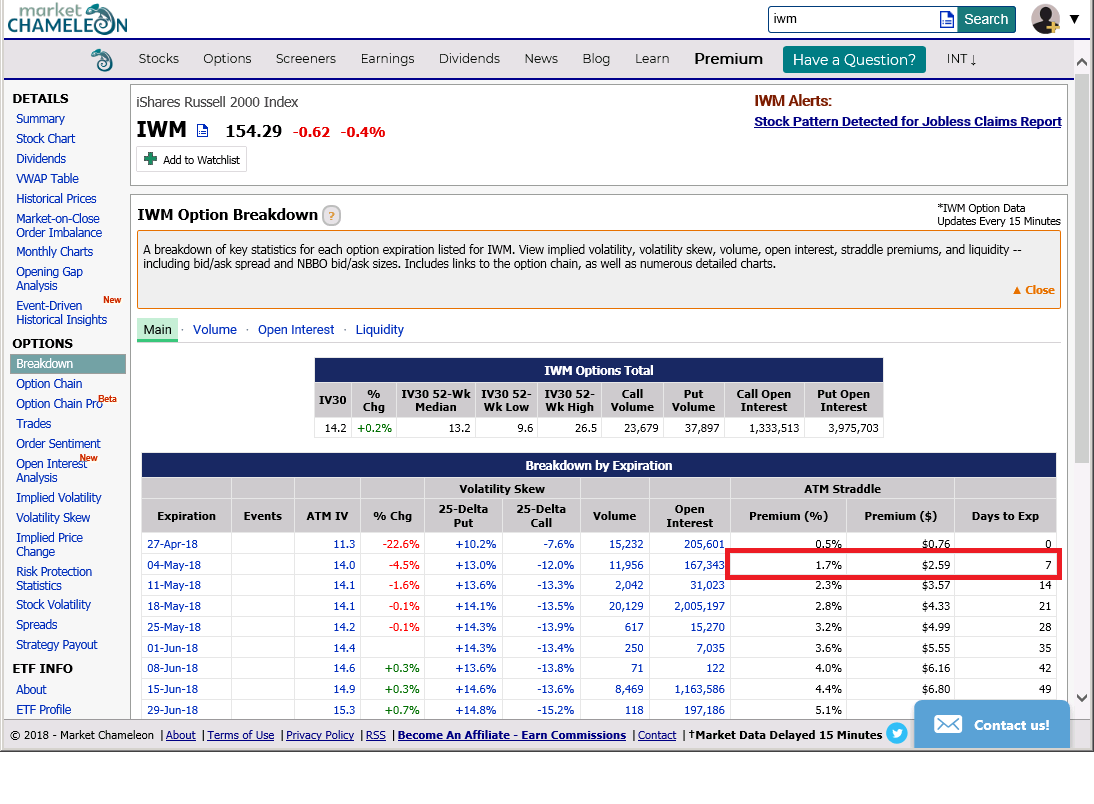
Example Option Breakdown Page for IWM

Highlighted above is a straddle with a premium of 1.7% and 7 days to expiration for IWM, which can be found in the option breakdown page.

Entering a 7 day rolling period for IWM using 2 years of historical prices and entering a 1.7% move in the quick check shows, in the last 2 years, the number of occurrences above 1.7% (3.6%) and below 1.7% (3.2%).

Example of Historical Price Distribution Quick Check