Option Volatility Skew
Skew is the implied volatility disparity between different strike prices within the same expiration. In some cases,
implied volatility is relatively equal along all strikes in an expiration, which is referred to as a "straight skew" or
a "flat skew". However, this is not common. Market forces dictate that some strikes get bid up to higher volatilities,
while others sold lower.
On a typical volatility skew, downside strikes have higher implied volatility, because historically stocks tend to fall with much
greater speed and magnitude. Drops in stock prices go along with increased uncertainty in the market. Conversely, on upside strikes,
the implied volatility is typically lower, as markets tend to go up in a more steady, constrained way.
Measuring Skew
Skew can be measured in many ways. In many places throughout our site, we refer to skew as it relates to the
at-the-money strike volatility (ATM Volatility). We compare the volatility for a downside put strike, usually the
25-Delta put (or the closest strike to the 25-Delta) to the ATM Volatiltiy, as well as an upside call strike (the 25-Delta or closest).
If a 25-Delta put skew is indicated as being +25.0%, that means the volatility on that strike is 25% higher than the
volatility on the ATM strike. Likewise for the call. A 25-Delta call skew of -20.0% is 20% lower than the ATM volatility.
Example
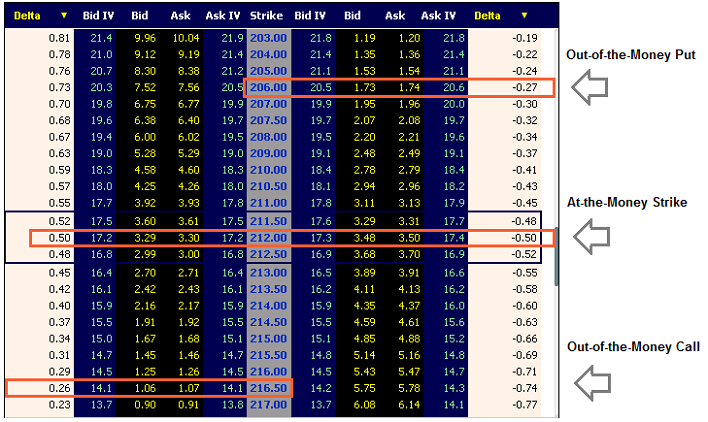
The example below is pulled from a recent expiration in SPY [SPY Option Chain]. We've highlighted the
out-of-the-money 25-Delta put and the out-of-the-money 25-Delta call, as well as the at-the-money strike. You can see the difference in Implied Volatility (IV)
from the downside, which is 20.5 Vol, to the at-the-money, which is 17.3 Vol, to the upside at 14.1 Vol.
Skew Over Time
To benchmark the skew for a stock over time, we record these values for all expirations and calculate a corresponding
30-Day Constant Maturity Skew. These values are calculated to always be looking 30 days ahead, at the 25-Delta put strike and
25-Delta call strike, so that changes in stock price, ATM volatility, or time left until expiration are normalized.
By comparing the current 30-Day Constant Maturity Skew to historical values, we can know whether the market is shifting
in a bearish or bullish trend. When 25-Delta put skew moves from being +10.0% historically to being +15.0% currently,
that would indicate that the markets are more bearish than usual, as traders are paying a higher relative premium for the
expectation of a downside move.
How to Use Skew
These are but a few of the many ways to use skew when analyzing the markets:
- Some investors may just want to know if markets are feeling more bearish or bullish. What are markets forecasting vs. average historical levels?
- Some investors may take the other side of the bet, hoping that the skew reverts to historical averages.
- Others may compare the skew of all stocks within some peer group and trade one security's skew versus another.


