Relative Strength Performance Example by Market Chameleon
What is the relative strength of a stock?
The relative strength of a stock is a comparison of the stock's price peformance against the price performance of broader stock market index.
For instance, comparing the stock performance of AAPL (Apple Inc.) to the performance of SPY (the ETF that represents S&P 500 Index - a basket of 500 major U.S. companies).
This helps traders identify if a stock's performance is weaker or stronger than the comparison benchmark.
What is an example of relative strength?
A good way to help you understand the relative strength of a stock's performance is through an example in the real estate market.
Let's say you were investing in real estate and wanted to know which areas of the country had the strongest or weakest markets.
You may want to compare historical property prices of the counties to the rest of the country.
To help you identify a strong county, you could measure how much the prices have gone up or down in comparison to the rest of the country.
A county with a strong real estate market would have property prices appreciating more than the prices as a whole in the country.
Also, the prices would not go down as much as the rest of the country when the real estate market was declining.
Therefore, that county would show a strong relative strength.
Furthermore, you can use various key measurements to support the trend you have identified. For instance, besides property prices you can also measure relative rents, population growth, unemployment rate, average salary etc..
How do you measure a stock's relative strength?
First we need to find a benchmark like SPY which is an ETF that represents the S&P 500 index. Then we can create metrics to compare how a stock
performed relative to this ETF. Let's examine the Relative Strength Performance in Visa.
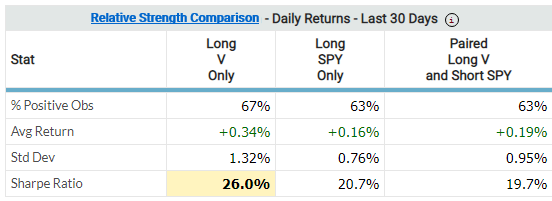
We want to know how well Visa stock price performed compared SPY. From the screenshot below,
based on the last 30 days of daily stock price returns,
you can see that V has performed better than the market. V had more up days (67% positive observations) than SPY (63% positive observations).
Furthermore, the average daily returns were 2 times greater than the market (V at .34% -vs- SPY at .16%), yet the volatility of the returns for V was only 1.7 times greater than that of SPY (V standard deviation of 1.32% -vs- SPY standard deviation of .76%). Therefore, looking at the ratio of average returns over the standard deviation (Sharpe Ratio) shows that V returned more per unit of risk, giving it a stronger performance relative to the market (26% -vs- 20.7%).
The relative strength is a good demonstration that a stock has strong support from market participants.
Where can I find relative strength of a stock?
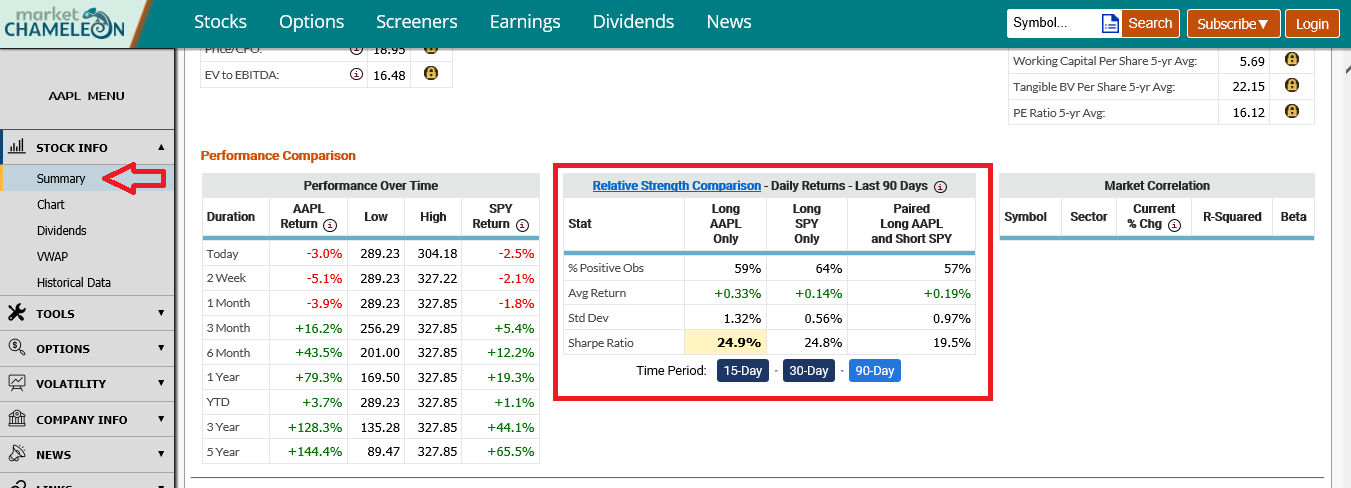
When you go to the summary page (for example AAPL https://marketchameleon.com/Overview/AAPL?ref=from_learn) of any stock and scroll down to the bottom, you will see the Relative Strength Comparison table (see screenshot below).
Watch the video to find out more about relative stock strength