S&P 500 Q3 2018 Buybacks Surpass $200 Billion Mark for the First Time Ever
PRNewswire 18-Dec-2018 11:00 AM
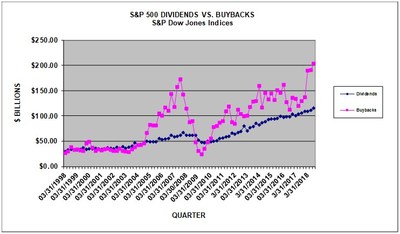
NEW YORK, Dec. 18, 2018 /PRNewswire/ -- S&P Dow Jones Indices ("S&P DJI") announced today that preliminary Q3 2018 S&P 500® stock buybacks, or share repurchases, surpassed the $200 billion mark for the first time to set a record $203.8 billion. This is the third consecutive record, displacing the prior quarterly record of $190.6 billion, set during Q2 2018 and a 57.7% increase from the $129.2 billion reported for Q3 2017. For the first three quarters of 2018, buybacks are up 52.6% to $583.4 billion from the prior year's $382.4 billion, and stand 1% away from the annual record, set in 2007, of $589.1 billion with a full quarter yet to report.
For the 12-month period ending September 2018, S&P 500 issues spent a record $720.4 billion on buybacks, up 39.1% from $517.7 billion for the corresponding 2017 period.
Historical data on S&P 500 buybacks are available at www.spdji.com/indices/equity/sp-500.
Key Takeaways:
- The percentage of issues with substantially reduced share counts of at least 4% year-over-year rose to 17.7%, up from the prior quarter's 15.4%. This is the highest since the 19.4% posted in Q4 2016.
- For Q3 2018, 88 issues experienced substantially reduced share counts, up from 79 for Q2 2018 and 70 for Q3 2017.
- Total shareholder return of buybacks and dividends for the quarter set a record of $319.5 billion, up 36.2% from the $234.6 billion reported for Q3 2017.
- S&P 500 dividends totaled $115.7 billion, a new record, up 3.7% from the $111.6 billion in Q2 2018.
- Total shareholder return for the 12-month period ending September 2018 set a record at $1.166 trillion, surpassing Q2's record $1.081 trillion, and up 25.2% from $931.9 billion for the corresponding 2017 period.
- 286 S&P 500 issues reduced their share count during Q3 2018, compared to 305 during Q2 2018 and 274 during Q3 2017.
"Companies have used their tax savings to push up discretionary buybacks and boost earnings through significantly reduced share counts," said Howard Silverblatt, Senior Index Analyst at S&P Dow Jones Indices. "Adding to the impact, Q4 average issue prices have declined 3.3% which would increase the number of shares a company can buy with the same expenditure and further increase the EPS tailwind."
"The buying, while broad, continued to be top heavy, with the top 20 issues accounting for 54.3% of all S&P 500 buybacks, a level not seen since Q1 2010, when it was at 59.8%."
Q2 2018 GICS® Sector Analysis:
Information Technology expenditures increased 15.1%, after Q2's 12.8% gain, to $82.3 billion – compared to $71.5 billion for Q2 2018 and $27.9 billion for Q3 2017. The sector represents 40.4% of the index's buybacks, up from 21.6% for Q3 2017.
Energy expenditures increased 71.1% to $7.3 billion compared to $4.3 billion for Q2 2018 and were up 216% from their $2.3 billion posted in Q3 2017, but remained at 61.2% of their $112.0 billion Q3 2013 expenditure 5-years ago.
Consumer sectors split, as Consumer Discretionary buybacks decreased their expenditure 13.1% to $19.7 billion, down from $22.7 billion for Q2 2018. Consumer Staples increased 52.4% to $10.0 billion, up from $6.6 billion for Q2 2018.
Issues:
The five issues with the highest total buybacks for Q2 2018 are:
- QUALCOMM (QCOM) led in buybacks, spending $21.2 billion in Q3 2018, ranking third on the top 20 S&P 500 historical list, up from $1.1 billion spent for Q2 2018
- Apple (AAPL) reported $19.4 billion in Q3 2018, down from $21.9 billion spent for Q2 2018, as the quarter ranked fifth highest historically; Apple holds seven of the top eight positions for buybacks historically, spending $224.2 billion over the past five-years.
- Oracle (ORCL): $10.3 billion for Q3 2018, up from $5.0 billion for Q2 2018 and $0.8 billion for Q3 2017.
- Wells Fargo (WFC): $7.4 billion for Q3 2018, up from $2.9 billion for Q2 2018 and up from $2.6 billion for Q3 2017.
- Cisco Systems (CSCO): $5.4 billion for Q3 2018, down from $6.1 billion for Q2 2018 and $2.0 billion for Q3 2017.
Total Shareholder Return:
Silverblatt determined that total shareholder return, through regular cash dividends and buybacks, increased 5.7% to $319.5 billion, up from $302.2 billion for Q2 2018 and up 26.2% from the $234.6 billion for Q3 2017.
For the 12-month period ending September 2018, shareholder return totaled $1.166 trillion, up 25.2% from $931.9 billion for the 12-month period ending September 2017.
S&P 500 dividends posted a new record payment for Q3 2018, at $115.7 billion, and was up 9.7% from its $105.4 billion Q3 2017 payment. Dividend payments totaled a record $446.0 billion for the 12-month period ending September 2018, up 7.7% from $414.1 billion for the 12-month period ending September 2017.
"Shareholder return for the first three quarters of 2018 has increased significantly, with Q4 appearing to continue the trend, as companies give some of their tax savings back to shareholders directly through dividends, and indirectly through stock repurchases, as both buybacks and dividends are set to post new annual records," said Silverblatt.
"Buybacks continue to be a high corporate priority, and favorite, as they support stock price via more purchases and increase EPS through lower share counts.
"One strong takeaway is the trend in dividends where more issues continue to increase with greater average size increases. Dividends, unlike buybacks, are a pure cash-flow item, so when they are increased, companies are usually very confident of their future earnings flow," said Silverblatt.
For more information about S&P Dow Jones Indices, please visit www.spdji.com.
|
S&P Dow Jones Indices
|
|
|
|
|
|
|
|
|
|
S&P 500, $ U.S. BILLIONS
|
|
(preliminary in bold)
|
|
|
|
|
|
|
|
PERIOD
|
MARKET
|
OPERATING
|
AS REPORTED
|
|
|
|
|
DIVIDEND &
|
DIVIDENDS
|
|
VALUE
|
EARNINGS
|
EARNINGS
|
DIVIDENDS
|
BUYBACKS
|
DIVIDEND
|
BUYBACK
|
BUYBACK
|
& BUYBACKS
|
|
$ BILLIONS
|
$ BILLIONS
|
$ BILLIONS
|
$ BILLIONS
|
$ BILLIONS
|
YIELD
|
YIELD
|
YIELD
|
$ BILLION
|
|
12 Months Sep 2018
|
$24,579.28
|
$1,276.68
|
$1,106.65
|
$445.96
|
$720.40
|
1.81%
|
2.93%
|
4.75%
|
$1,166.36
|
|
12 Months Sep 2017
|
$21,578.98
|
$1,017.18
|
$918.66
|
$414.13
|
$517.72
|
1.92%
|
2.40%
|
4.32%
|
$931.85
|
|
|
|
|
|
|
|
|
|
|
|
2017
|
$22,821.24
|
$1,066.00
|
$940.86
|
$419.77
|
$519.40
|
1.84%
|
2.28%
|
4.12%
|
$939.17
|
|
2016
|
$19,267.93
|
$919.85
|
$818.55
|
$397.21
|
$536.38
|
2.06%
|
2.78%
|
4.85%
|
$933.60
|
|
2015
|
$17,899.56
|
$885.38
|
$762.74
|
$382.32
|
$572.16
|
2.14%
|
3.20%
|
5.33%
|
$954.47
|
|
|
|
|
|
|
|
|
|
|
|
9/30/2018 Prelim.
|
$24,579
|
$348.95
|
$306.70
|
$115.72
|
$203.76
|
1.81%
|
2.93%
|
4.75%
|
$319.47
|
|
6/30/2018
|
$23,036
|
$327.53
|
$288.55
|
$111.60
|
$190.62
|
1.89%
|
2.80%
|
4.69%
|
$302.22
|
|
3/29/2018
|
$22,496
|
$311.26
|
$281.28
|
$109.18
|
$189.05
|
1.90%
|
2.56%
|
4.46%
|
$298.23
|
|
12/29/2017
|
$22,821
|
$288.93
|
$230.12
|
$109.46
|
$136.97
|
1.84%
|
2.28%
|
4.12%
|
$246.43
|
|
9/29/2017
|
$21,579
|
$268.35
|
$243.68
|
$105.45
|
$129.17
|
1.92%
|
2.40%
|
4.32%
|
$234.61
|
|
6/30/2017
|
$20,762
|
$261.39
|
$231.40
|
$104.01
|
$120.11
|
1.96%
|
2.41%
|
4.37%
|
$224.12
|
|
3/31/2017
|
$20,276
|
$247.32
|
$235.65
|
$100.86
|
$133.15
|
1.98%
|
2.51%
|
4.49%
|
$234.01
|
|
12/31/2016
|
$19,268
|
$240.11
|
$207.93
|
$103.82
|
$135.29
|
2.06%
|
2.78%
|
4.85%
|
$239.11
|
|
9/30/2016
|
$18,742
|
$247.98
|
$219.46
|
$98.43
|
$112.20
|
2.10%
|
2.92%
|
5.01%
|
$210.63
|
|
6/30/2016
|
$18,193
|
$222.77
|
$201.79
|
$98.30
|
$127.50
|
2.14%
|
3.22%
|
5.36%
|
$225.81
|
|
3/31/2016
|
$17,958
|
$208.99
|
$189.37
|
$96.67
|
$161.39
|
2.15%
|
3.28%
|
5.43%
|
$258.05
|
|
12/31/2015
|
$17,900
|
$201.95
|
$163.76
|
$99.39
|
$145.88
|
2.14%
|
3.20%
|
5.33%
|
$245.27
|
|
9/30/2015
|
$16,917
|
$224.14
|
$204.58
|
$95.07
|
$150.58
|
2.22%
|
3.30%
|
5.52%
|
$245.66
|
|
6/30/2015
|
$18,219
|
$230.84
|
$201.35
|
$94.45
|
$131.56
|
2.03%
|
3.04%
|
5.07%
|
$226.01
|
|
3/31/2015
|
$18,303
|
$228.45
|
$193.05
|
$93.41
|
$144.13
|
1.98%
|
2.94%
|
4.92%
|
$237.54
|
|
12/30/2014
|
$18,245
|
$237.14
|
$202.31
|
$92.80
|
$132.63
|
1.92%
|
3.03%
|
4.95%
|
$225.43
|
|
9/30/2014
|
$17,519
|
$262.92
|
$244.00
|
$89.02
|
$145.19
|
1.96%
|
3.14%
|
5.10%
|
$234.22
|
|
6/30/2014
|
$17,404
|
$260.50
|
$240.96
|
$86.65
|
$116.17
|
1.91%
|
3.06%
|
4.98%
|
$202.82
|
|
3/31/2014
|
$16,700
|
$243.67
|
$221.82
|
$81.96
|
$159.28
|
1.93%
|
3.20%
|
5.14%
|
$241.24
|
|
12/31/2013
|
$16,495
|
$252.10
|
$236.31
|
$84.98
|
$129.41
|
1.89%
|
2.88%
|
4.77%
|
$214.40
|
|
9/30/2013
|
$14,960
|
$239.50
|
$219.13
|
$79.26
|
$128.16
|
2.05%
|
2.98%
|
5.03%
|
$207.42
|
|
6/30/2013
|
$14,310
|
$234.84
|
$221.56
|
$76.67
|
$118.05
|
2.07%
|
2.94%
|
5.02%
|
$194.72
|
|
3/31/2013
|
$13,979
|
$229.57
|
$215.76
|
$70.86
|
$99.97
|
2.06%
|
2.97%
|
5.02%
|
$170.82
|
|
S&P Dow Jones Indices
|
|
|
|
|
|
|
|
S&P 500 SECTOR BUYBACKS
|
|
|
|
|
|
|
|
SECTOR $ MILLIONS
|
Q3,'18
|
Q2,'18
|
Q3,'17
|
12MoSep','18
|
12MoSep','17
|
5-YEARS
|
|
|
|
|
|
|
|
|
Consumer Discretionary
|
$19,688
|
$22,656
|
$24,242
|
$81,798
|
$83,398
|
$425,986
|
|
Consumer Staples
|
$10,025
|
$6,580
|
$15,578
|
$34,351
|
$51,957
|
$216,679
|
|
Energy
|
$7,330
|
$4,285
|
$2,320
|
$26,932
|
$8,513
|
$108,642
|
|
Financials
|
$40,643
|
$29,968
|
$34,252
|
$138,316
|
$117,336
|
$519,274
|
|
Healthcare
|
$14,482
|
$27,241
|
$9,523
|
$93,170
|
$78,066
|
$374,840
|
|
Industrials
|
$15,159
|
$23,426
|
$13,087
|
$66,775
|
$56,771
|
$348,001
|
|
Information Technology
|
$82,293
|
$71,511
|
$27,926
|
$253,044
|
$111,762
|
$795,091
|
|
Materials
|
$3,014
|
$3,237
|
$1,412
|
$10,601
|
$6,287
|
$70,385
|
|
Real Estate
|
$520
|
$884
|
$806
|
$3,602
|
$2,833
|
$6,891
|
|
Communication Services
|
$10,092
|
$419
|
$3
|
$10,690
|
$545
|
$22,412
|
|
Utilities
|
$509
|
$413
|
$22
|
$1,119
|
$250
|
$5,850
|
|
TOTAL
|
$203,756
|
$190,621
|
$129,170
|
$720,397
|
$517,720
|
$2,894,052
|
|
S&P Dow Jones Indices
|
|
|
|
|
|
|
|
|
S&P 500 20 LARGEST Q3 2018 BUYBACKS, $ MILLIONS
|
|
|
|
|
|
|
Company
|
Ticker
|
Sector
|
Q3,'18
|
12MO Sep,'18
|
12MO Sep,'17
|
5-Year
|
10-Year
|
|
|
|
Buybacks
|
Buybacks
|
Buybacks
|
Buybacks
|
Buybacks
|
|
|
|
$ Million
|
$ Million
|
$ Million
|
$ Million
|
$ Million
|
|
QUALCOMM
|
QCOM
|
Information Technology
|
$21,162
|
$22,860
|
$1,610
|
$44,188
|
$51,466
|
|
Apple
|
AAPL
|
Information Technology
|
$19,364
|
$75,265
|
$34,774
|
$224,241
|
$250,335
|
|
Oracle
|
ORCL
|
Information Technology
|
$10,346
|
$21,366
|
$2,505
|
$51,518
|
$76,987
|
|
Wells Fargo
|
WFC
|
Financials
|
$7,393
|
$16,518
|
$9,481
|
$52,056
|
$63,140
|
|
Cisco Systems
|
CSCO
|
Information Technology
|
$5,394
|
$21,616
|
$4,908
|
$44,899
|
$72,315
|
|
Citigroup
|
C
|
Financials
|
$5,166
|
$15,800
|
$13,599
|
$42,718
|
$45,553
|
|
Facebook
|
FB
|
Communication Services
|
$5,161
|
$13,886
|
$3,378
|
$17,526
|
$21,095
|
|
Bank of America
|
BAC
|
Financials
|
$5,040
|
$19,732
|
$9,275
|
$38,189
|
$40,058
|
|
JPMorgan Chase
|
JPM
|
Financials
|
$4,416
|
$18,863
|
$12,853
|
$49,222
|
$67,227
|
|
Microsoft
|
MSFT
|
Information Technology
|
$3,744
|
$11,895
|
$9,996
|
$61,793
|
$100,054
|
|
Starbucks
|
SBUX
|
Consumer Discretionary
|
$3,074
|
$7,196
|
$2,125
|
$13,771
|
$15,944
|
|
Walgreens Boots Alliance
|
WBA
|
Consumer Staples
|
$2,703
|
$5,228
|
$5,220
|
$13,531
|
$19,400
|
|
Intel
|
INTC
|
Information Technology
|
$2,684
|
$8,956
|
$4,134
|
$30,686
|
$55,533
|
|
Boeing
|
BA
|
Industrials
|
$2,461
|
$10,412
|
$8,128
|
$39,075
|
$40,400
|
|
Home Depot
|
HD
|
Consumer Discretionary
|
$2,397
|
$7,451
|
$8,412
|
$36,498
|
$53,104
|
|
Walmart
|
WMT
|
Consumer Staples
|
$2,317
|
$5,801
|
$8,700
|
$26,759
|
$61,643
|
|
Booking Holdings
|
BKNG
|
Consumer Discretionary
|
$2,205
|
$4,815
|
$1,380
|
$10,790
|
$12,240
|
|
Alphabet
|
GOOG
|
Communication Services
|
$2,200
|
$8,526
|
$2,745
|
$16,744
|
$17,662
|
|
Lam Research
|
LRCX
|
Information Technology
|
$1,736
|
$4,234
|
$965
|
$6,073
|
$8,423
|
|
Amgen
|
AMGN
|
Health Care
|
$1,729
|
$16,650
|
$3,614
|
$24,652
|
$46,126
|
|
Top 20
|
|
|
$110,692
|
$317,070
|
$147,803
|
$844,928
|
$1,118,705
|
|
S&P 500
|
|
|
$203,756
|
$720,397
|
$517,720
|
$2,894,053
|
$4,528,798
|
|
Top 20 % of S&P 500
|
|
|
54.33%
|
44.01%
|
28.55%
|
29.20%
|
24.70%
|
|
Gross values are not adjusted for float
|
|
|
|
|
|
|
S&P Dow Jones Indices
|
|
|
|
S&P 500 20 Largest Quarterly Buybacks, $ Millions, as of Q3 2018 with 2 added
|
|
|
$ MILLIONS
|
QUARTER
|
COMPANY
|
SECTOR
|
|
|
$22,756
|
Q1 2018
|
Apple
|
Information Technology
|
1
|
|
$21,860
|
Q2 2018
|
Apple
|
Information Technology
|
2
|
|
$21,162
|
Q3 2018
|
QUALCOMM
|
Information Technology
|
3
|
|
$20,783
|
Q2 2018
|
Apple
|
Information Technology
|
4
|
|
$19,364
|
Q3 2018
|
Apple
|
Information Technology
|
5
|
|
$17,971
|
Q1 2014
|
Apple
|
Information Technology
|
6
|
|
$17,000
|
Q3 2014
|
Apple
|
Information Technology
|
7
|
|
$16,000
|
Q2 2013
|
Apple
|
Information Technology
|
8
|
|
$15,707
|
Q2 2007
|
International Business Machines
|
Information Technology
|
9
|
|
$13,253
|
Q3 2015
|
Apple
|
Information Technology
|
10
|
|
$12,852
|
Q2 2012
|
Johnson & Johnson
|
Healthcare
|
11
|
|
$12,318
|
Q4 2016
|
Allergan plc (AGN)
|
Healthcare
|
12
|
|
$12,183
|
Q3 2012
|
Johnson & Johnson
|
Healthcare
|
13
|
|
$10,851
|
Q4 2016
|
Apple
|
Information Technology
|
14
|
|
$10,723
|
Q3 2007
|
Home Depot
|
Consumer Discretionary
|
15
|
|
$10,697
|
Q1 2018
|
Amgen
|
Healthcare
|
16
|
|
-$10,346
|
Q3 2018
|
Oracle
|
Information Technology
|
17
|
|
$10,166
|
Q2 2016
|
Apple
|
Information Technology
|
18
|
|
$10,095
|
Q4 2017
|
Apple
|
Information Technology
|
19
|
|
$10,000
|
Q2 2015
|
Apple
|
Information Technology
|
20
|
|
$275,395
|
|
TOP 20
|
|
|
|
S&P Dow Jones Indices
|
|
|
|
|
|
S&P 500 Q3 2018 Buyback Report
|
|
|
|
|
|
|
|
|
|
SECTOR
|
DIVIDEND
|
BUYBACK
|
COMBINED
|
|
|
YIELD
|
YIELD
|
YIELD
|
|
|
Consumer Discretionary
|
1.48%
|
3.20%
|
4.68%
|
|
|
Consumer Staples
|
3.45%
|
2.15%
|
5.60%
|
|
|
Energy
|
3.42%
|
2.13%
|
5.54%
|
|
|
Financials
|
2.38%
|
4.71%
|
7.09%
|
|
|
HealthCare
|
1.73%
|
2.69%
|
4.42%
|
|
|
Industrials
|
2.16%
|
3.26%
|
5.43%
|
|
|
Information Technology
|
1.79%
|
5.43%
|
7.23%
|
|
|
Materials
|
2.40%
|
1.98%
|
4.39%
|
|
|
Real Estate
|
3.46%
|
0.54%
|
3.99%
|
|
|
Telecommunication Services
|
1.88%
|
2.26%
|
4.15%
|
|
|
Utilities
|
3.33%
|
0.10%
|
3.43%
|
|
|
S&P 500
|
2.21%
|
3.34%
|
5.56%
|
|
|
Uses full values (unadjusted for float)
|
|
|
|
|
Dividends based on indicated; buybacks based on the last 12-months ending Q3'18
|
|
Share Count Reduction (SCR)
|
SCR
|
SCR
|
|
(Y/Y diluted shares used for EPS)
|
>=4%
|
<=-4%
|
|
Q3 2018
|
6.43%
|
17.67%
|
|
Q2 2018
|
6.21%
|
15.43%
|
|
Q1 2018
|
7.01%
|
13.63%
|
|
Q4 2017
|
6.83%
|
15.06%
|
|
Q3 2017
|
8.62%
|
14.23%
|
|
Q2 2017
|
10.00%
|
14.00%
|
|
Q1 2017
|
12.00%
|
14.80%
|
|
Q4 2016
|
10.48%
|
19.35%
|
|
Q3 2016
|
9.94%
|
23.73%
|
|
Q2 2016
|
10.48%
|
26.61%
|
|
Q1 2016
|
10.06%
|
28.17%
|
|
Q4 2015
|
9.48%
|
25.81%
|
|
Q3 2015
|
9.64%
|
22.69%
|
|
Q2 2015
|
9.04%
|
21.08%
|
|
Q1 2015
|
7.62%
|
21.04%
|
|
Q4 2014
|
6.04%
|
21.33%
|
ABOUT S&P DOW JONES INDICES
S&P Dow Jones Indices is the largest global resource for essential index-based concepts, data and research, and home to iconic financial market indicators, such as the S&P 500® and the Dow Jones Industrial Average®. More assets are invested in products based on our indices than products based on indices from any other provider in the world. Since Charles Dow invented the first index in 1884, S&P DJI has been innovating and developing indices across the spectrum of asset classes helping to define the way investors measure and trade the markets.
S&P Dow Jones Indices is a division of S&P Global (NYSE:SPGI), which provides essential intelligence for individuals, companies, and governments to make decisions with confidence. For more information, visit: www.spdji.com.
 View original content to download multimedia:http://www.prnewswire.com/news-releases/sp-500-q3-2018-buybacks-surpass-200-billion-mark-for-the-first-time-ever-300768130.html
SOURCE S&P Dow Jones Indices