California Resources Corporation Announces Fourth Quarter 2018 and Full Year Results
Business Wire 27-Feb-2019 4:15 PM
California Resources Corporation (NYSE:CRC), an independent
California-based oil and gas exploration and production company, today
reported net income attributable to common stock (CRC net income) of
$346 million, or $7.00 per diluted share, for the fourth quarter of
2018. Adjusted net income1 for the fourth quarter of 2018 was
$26 million, or $0.53 per diluted share. For the full year of 2018, CRC
net income was $328 million, or $6.77 per diluted share. Adjusted net
income1 for the full year of 2018 was $61 million, or $1.27
per diluted share.
This press release features multimedia. View the full release here:
https://www.businesswire.com/news/home/20190227005941/en/
4Q and Full Year CRC Earnings Infographic (Graphic: Business Wire)
Adjusted EBITDAX1 for the fourth quarter of 2018 was $314
million and $1,117 million for the full year of 2018. Cash provided by
operating activities was $68 million for the fourth quarter of 2018 and
$461 million for the full year of 2018, or an 86% increase over the full
year $248 million in 2017.
Quarterly Highlights
-
Produced an average of 136,000 barrels of oil equivalent (BOE) per
day, an increase of 8% over the prior year period
-
Produced an average of 86,000 barrels of oil per day, an increase of
8% over the prior year period
-
Generated core adjusted EBITDAX1 of $352 million, which
excludes $50 million of net settlement payments on commodity
derivative contracts offset by $12 million related to cash-settled
stock-based compensation
-
Reported adjusted EBITDAX1 of $314 million and an adjusted
EBITDAX margin1 of 41%
-
Invested $197 million of total capital, including internally funded
capital of $174 million with the remainder funded by joint venture
(JV) partners
-
Drilled 86 wells with internally funded capital and five wells with JV
capital
Full Year Highlights
-
Produced an average of 132,000 BOE per day, an increase of 2% over the
prior year
-
Generated core adjusted EBITDAX1 of $1,374 million, which
excludes $228 million of net settlement payments on commodity
derivative contracts and $29 million related to cash-settled
stock-based compensation
-
Reported adjusted EBITDAX1 of $1,117 million and an
adjusted EBITDAX margin1 of 39%
-
Invested $747 million of total capital, including internally funded
capital of $641 million with the remainder funded by JV partners
-
Drilled 237 wells with internally funded capital and 106 wells with JV
capital
-
Implemented $34 million of annualized synergies in the nine months
following the Elk Hills acquisition, significantly exceeding the
initial target of $20 million in a shorter time frame than expected
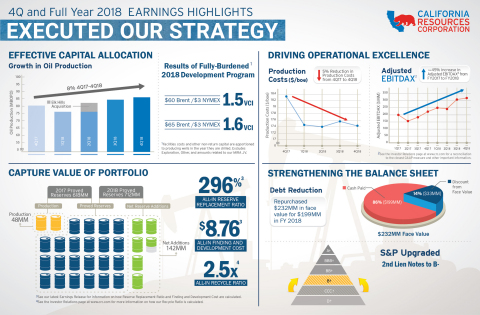
Todd A. Stevens, CRC's President and Chief Executive Officer, said, "In
2018, our strategic approach focused on capturing the full value of our
portfolio, driving operational excellence, efficiently and effectively
allocating capital, and strengthening the balance sheet. We made good
progress on each priority, increasing the impact of our investment
program and delivering 8% growth in oil production from the fourth
quarter of 2017 to the fourth quarter of 2018. We invested in
value-driven activity to develop our core and growth areas with the
support of strategic JV capital, in addition to successfully resuming
our exploration program. We also harnessed our operating expertise to
generate more synergies than expected around the consolidation of our
flagship Elk Hills asset. We are entering 2019 with a internally funded
capital program of $300 to $385 million, which we will adjust to align
our financial and operating plans to market conditions. We are also in
discussions to obtain additional investments from new and existing JV
partners that could increase our capital program by $100-$150 million to
support a total capital budget of approximately $500 million. This will
allow us to maintain activity and efficiency gains, while retaining a
high degree of operational flexibility. Supported by our diverse asset
base, high level of operating control and dynamic business model, we
expect to continue to deliver meaningful value for our shareholders in
2019 and beyond."
Fourth Quarter 2018 Results
For the fourth quarter of 2018, CRC net income was $346 million, or
$7.00 per diluted share, compared to a net loss attributable to common
stock (CRC net loss) of $138 million, or $3.23 per diluted share for the
same period of 2017. Adjusted net income1 for the fourth
quarter of 2018 was $26 million, or $0.53 per diluted share, compared
with an adjusted net loss1 of $14 million, or $0.33 per
diluted share for the same prior year period. The 2018 results reflected
increased production and higher realized commodity prices for oil and
natural gas compared to 2017. The fourth quarter of 2018 adjusted net
income1 excluded $295 million of non-cash derivative gains on
commodity contracts, a $6 million non-cash derivative loss from
interest-rate contracts and a net gain of $31 million on debt
repurchases.
Total daily production volumes averaged 136,000 BOE per day for the
fourth quarter of 2018, compared to 126,000 BOE per day for the fourth
quarter of 2017, an increase of 8%, largely driven by the Elk Hills
acquisition in the second quarter of 2018. For the fourth quarter of
2018, oil volumes averaged 86,000 barrels per day, NGL volumes averaged
16,000 barrels per day and gas volumes averaged 204,000 thousand cubic
feet (MCF) per day. Organically, oil production grew over 1,000 barrels
per day from the third quarter of 2018 to the fourth quarter of 2018,
excluding the effects of production sharing-type contracts (PSCs) and
acquisitions.
Realized crude oil prices, including the effect of settled hedges,
increased by $3.05 per barrel for the fourth quarter of 2018 to $59.97
per barrel from the same prior year period. Settled hedges decreased
realized crude oil prices by $6.15 per barrel for the fourth quarter of
2018. Average realized NGL prices registered $43.56 per barrel,
reflecting a realized price that was 64% of Brent prices. Realized
natural gas prices were $3.77 per MCF for the fourth quarter of 2018,
$1.00 higher than the same prior year period. The increase in realized
gas prices resulted from the effects of limited third-party storage and
pipeline constraints.
Production costs for the fourth quarter of 2018 were $233 million, or
$18.61 per BOE, compared to $227 million, or $19.64 per BOE, for the
fourth quarter of 2017. In line with industry practice for reporting
PSCs, CRC reports gross field operating costs, but only CRC's share of
production volumes, which results in higher production costs per barrel.
Excluding this PSC effect, per unit production costs1 for the
fourth quarter of 2018 would have been $17.44 per BOE compared to $18.31
for the same prior year period. The decrease in production costs per BOE
was primarily driven by higher production between comparative periods,
largely related to the Elk Hills acquisition. Elk Hills' production
costs are lower than the average CRC-wide production cost per barrel. As
a result, the Elk Hills acquisition had a favorable effect on production
cost per barrel. General and administrative expenses (G&A) were $65
million for the fourth quarter of 2018 compared to $66 million for the
prior year period.
CRC reported taxes other than on income of $29 million for the fourth
quarter of 2018 compared to $33 million for the same prior year period.
Exploration expense was $16 million for the fourth quarter of 2018, $11
million higher than the same prior year period due to exploration dry
holes.
CRC's internally funded capital investment for the fourth quarter of
2018 totaled $174 million, of which $119 million was directed to
drilling and capital workovers. CRC's JV partner Benefit Street Partners
LLC (BSP) funded $12 million, which is included in CRC's consolidated
results, while JV partner Macquarie Infrastructure and Real Assets Inc.
(MIRA) funded an additional $11 million of investment, which is excluded
from our consolidated results.
Cash provided by operating activities was $68 million for the fourth
quarter of 2018, which included interest payments of $157 million.
Full Year 2018 Results
For the full year of 2018, CRC net income was $328 million, or $6.77 per
diluted share, compared to a CRC net loss of $266 million, or $6.26 per
diluted share, for the full year of 2017. Adjusted net income1
for 2018 was $61 million, or $1.27 per diluted share, compared with an
adjusted net loss1 of $187 million, or $4.40 per diluted
share, for 2017. The 2018 results reflected significantly higher
realized prices and higher production, partially offset by increased
production costs, as well as higher G&A and interest expense. The 2018
adjusted net income1 excluded $224 million of non-cash
derivative gains on commodity contracts, a net gain of $57 million on
debt repurchases, a $6 million non-cash derivative loss from interest
rate contracts, a $5 million gain on asset divestitures and a net $13
million charge related to other unusual and infrequent items. The 2017
adjusted net loss1 excluded $78 million of non-cash
derivative losses, $21 million of gains from asset divestitures, a $4
million net gain on debt repurchases and a $26 million net charge from
other unusual and infrequent items.
Total daily production volumes averaged 132,000 BOE per day for the full
year of 2018 compared with 129,000 BOE per day for 2017. This net
increase included a 1,300 barrel per day negative PSC effect on
production volumes due to higher realized prices for 2018. Oil volumes
averaged 82,000 barrels per day, NGL volumes averaged 16,000 barrels per
day and gas volumes averaged 202,000 MCF per day.
Realized crude oil prices, including the effect of settled hedges,
increased $11.36 per barrel to $62.60 per barrel for the full year 2018
from $51.24 per barrel for 2017. Settled hedges reduced 2018 realized
crude oil prices by $7.51 per barrel compared with a $0.23 decrease per
barrel for 2017. Realized NGL prices increased 22% to $43.67 per barrel
for 2018 from $35.76 per barrel for 2017. Realized natural gas prices
increased 12% to $3.00 per MCF for 2018 compared with $2.67 per MCF for
2017.
Production costs for the full year of 2018 were $912 million, or $18.88
per BOE, compared to $876 million, or $18.64 per BOE, for 2017. The Elk
Hills acquisition and cash-settled stock-based compensation added $38
million and $4 million to full year production costs for 2018,
respectively. Synergies captured from the Elk Hills consolidation
reduced production costs by $17 million, partially offset by an increase
in energy costs. Per unit production costs, excluding the effect of PSC
contracts1, were $17.47 and $17.48 per BOE for the full year
of 2018 and 2017, respectively. G&A expenses were $299 million and $249
million for the full year of 2018 and 2017, respectively, with the
difference primarily related to increased equity compensation expense
resulting from CRC's higher stock price, as well as additional G&A
expense as a result of lower cost recovery following the Elk Hills
acquisition.
Taxes other than on income of $149 million for 2018 were $13 million
higher than 2017, primarily due to higher greenhouse gas (GHG) costs
related to annual price increases, in addition to a reduction in the
number of allowances granted to CRC between periods. CRC reported
exploration expenses of $34 million for the full year of 2018, or $12
million higher than 2017, due to exploration dry holes.
CRC's internally funded capital investment for 2018 totaled $641
million, of which $445 million was directed to drilling and capital
workovers. CRC's JV partner BSP funded an additional $49 million, which
is included in CRC's consolidated results, while JV partner MIRA funded
an additional $57 million of investment, which is excluded from our
consolidated results.
Cash provided by operating activities for the full year of 2018 was $461
million, which included interest payments of $441 million and $98
million of GHG payments related to prior years' allowances.
Operational Update
CRC operated an average of 10 drilling rigs during the fourth quarter of
2018 with five rigs focused on waterfloods, three on conventional
primary production, one on steamfloods and one on unconventional
production. CRC drilled 90 development wells and one exploration well
with CRC and JV capital (33 steamflood, 38 waterflood, 13 primary and 7
unconventional). Steamfloods and waterfloods have different production
profiles and longer response times than typical conventional wells and,
as a result, the full production contribution may not be experienced in
the same period that the well is drilled. In the San Joaquin basin, CRC
produced approximately 99,000 BOE per day and operated six rigs during
the fourth quarter of 2018. The Los Angeles basin contributed 26,000 BOE
per day of production and operated three rigs directed toward waterflood
projects during the fourth quarter of 2018. The Ventura basin produced
6,000 BOE per day and operated one rig directed toward waterflood
projects during the fourth quarter of 2018. The Sacramento basin
produced 5,000 BOE per day and had no active drilling program during the
fourth quarter of 2018.
2019 Capital Budget
With current oil prices slightly above $60 per barrel Brent, CRC
estimates its 2019 internally funded capital program will range from
$300 million to $385 million, which may be adjusted during the course of
the year depending on commodity prices. CRC is also in discussion to
obtain additional investments from new and existing JVs that could
increase the 2019 capital program by $100 to $150 million, to support a
total capital budget of approximately $500 million. CRC's internally
funded investments will be largely directed to quick payback projects,
such as primary drilling and capital workovers, and low-risk projects
including waterflood and steamflood investments that maintain base
production.
Balance Sheet Strengthening Update
For the fourth quarter of 2018, CRC repurchased a total of $55 million
in aggregate principal amount of CRC's outstanding debt for $50 million.
In 2018, CRC repurchased a total of $232 million in aggregate principal
amount of CRC's outstanding debt for $199 million. The majority of CRC's
debt repurchases focused on CRC's Second Lien Notes.
Year-End 2018 Reserves
CRC's proved reserves totaled 712 million barrels of oil equivalent
(MMBOE), an increase from 618 MMBOE in 2017. Excluding positive price
revisions, proved undeveloped reserves downgraded at management's
discretion and acquisitions, CRC organically replaced 127% of proved
reserves. CRC achieved this strong organic reserve replacement ratio
through well-executed capital programs in its Buena Vista, South Valley,
Huntington Beach and Long Beach areas of operations. In 2018, total
additions to proved reserves from all sources were 142 MMBOE, resulting
in an all-in reserve replacement ratio of 296%.
Hedging Update
CRC continues to opportunistically implement a hedging program to
protect its cash flow, operating margins and capital program, while
maintaining adequate liquidity. For the first and second quarters of
2019, CRC has protected the downside price risk of approximately 45,000
and 40,000 barrels per day at approximately $66 Brent and $70 Brent per
barrel, respectively. For the third and fourth quarters of 2019, CRC has
protected the downside price risk of approximately 40,000 and 35,000
barrels per day at approximately $73 Brent and $76 Brent per barrel,
respectively. Except for a small portion primarily in the first quarter
of 2019, the 2019 hedges do not contain caps, thereby providing upside
to oil price movements. See Attachment 10 for more details.
1 See Attachment 3 for how CRC calculates and uses the
non-GAAP measures of adjusted EBITDAX, core adjusted EBITDAX, adjusted
EBITDAX margin, free cash flow, production costs (excluding the effects
of PSC-type contracts) and adjusted net income (loss), and for
reconciliations of the foregoing to their nearest GAAP measure.
Conference Call Details
To participate in today's conference call scheduled for 5:00 P.M.
Eastern Standard Time, either dial (877) 328-5505 (International calls
please dial +1 (412) 317-5421) or access via webcast at www.crc.com,
fifteen minutes prior to the scheduled start time to register.
Participants may also pre-register for the conference call at http://dpregister.com/10127347.
A digital replay of the conference call will be archived for
approximately 30 days and supplemental slides for the conference call
will be available online in the Investor Relations section of www.crc.com.
About California Resources Corporation
California Resources Corporation is the largest oil and natural gas
exploration and production company in California on a gross-operated
basis. CRC operates its world-class resource base exclusively within the
State of California, applying complementary and integrated
infrastructure to gather, process and market its production. Using
advanced technology, California Resources Corporation focuses on safely
and responsibly supplying affordable energy for California by
Californians.
Forward-Looking Statements
This presentation contains forward-looking statements that involve risks
and uncertainties that could materially affect CRC's expected results of
operations, liquidity, cash flows and business prospects. Such
statements include those regarding CRC's expectations as to its future:
-
financial position, liquidity, cash flows and results of operations
-
business prospects
-
transactions and projects
-
operating costs
-
Value Creation Index (VCI) metrics, which are based on certain
estimates including future production rates, costs and commodity prices
-
operations and operational results including production, hedging and
capital investment
-
budgets and maintenance capital requirements
-
reserves
-
type curves
-
expected synergies from acquisitions and joint ventures
Actual results may differ from anticipated results, sometimes
materially, and reported results should not be considered an indication
of future performance. While CRC believes assumptions or bases
underlying its expectations are reasonable and make them in good faith,
they almost always vary from actual results, sometimes materially. CRC
also believes third-party statements it cites are accurate, but has not
independently verified them and does not warrant their accuracy or
completeness. Factors (but not necessarily all the factors) that could
cause results to differ include:
-
commodity price changes
-
debt limitations on CRC's financial flexibility
-
insufficient cash flow to fund planned investments, debt repurchases
or changes to CRC's capital plan
-
inability to enter desirable transactions, including acquisitions,
asset sales and joint ventures
-
legislative or regulatory changes, including those related to
drilling, completion, well stimulation, operation, maintenance or
abandonment of wells or facilities, managing energy, water, land,
greenhouse gases or other emissions, protection of health, safety and
the environment, or transportation, marketing and sale of our products
-
joint ventures and acquisitions and CRC's ability to achieve expected
synergies
-
the recoverability of resources and unexpected geologic conditions
-
incorrect estimates of reserves and related future cash flows and the
inability to replace reserves
-
changes in business strategy
-
PSC effects on production and unit production costs
-
effect of stock price on costs associated with incentive compensation
-
insufficient capital, including as a result of lender restrictions,
unavailability of capital markets or inability to attract potential
investors
-
effects of hedging transactions
-
equipment, service or labor price inflation or unavailability
-
availability or timing of, or conditions imposed on, permits and
approvals
-
lower-than-expected production, reserves or resources from development
projects, joint ventures or acquisitions, or higher-than-expected
decline rates
-
disruptions due to accidents, mechanical failures, transportation or
storage constraints, natural disasters, labor difficulties, cyber
attacks or other catastrophic events
-
factors discussed in "Risk Factors" in CRC's Annual Report on Form
10-K available on its website at crc.com.
Words such as "anticipate," "believe," "continue," "could," "estimate,"
"expect," "goal," "intend," "likely," "may," "might," "plan,"
"potential," "project," "seek," "should," "target, "will" or "would" and
similar words that reflect the prospective nature of events or outcomes
typically identify forward-looking statements. Any forward-looking
statement speaks only as of the date on which such statement is made and
CRC undertakes no obligation to correct or update any forward-looking
statement, whether as a result of new information, future events or
otherwise, except as required by applicable law.
|
|
|
Attachment 1
|
|
SUMMARY OF RESULTS
|
|
|
|
|
|
|
|
|
|
|
|
Fourth Quarter
|
|
Twelve Months
|
|
($ and shares in millions, except per share amounts)
|
|
2018
|
|
2017
|
|
2018
|
|
2017
|
|
|
|
|
|
|
|
|
|
|
|
Statement of Operations Data:
|
|
|
|
|
|
|
|
|
|
Revenues and Other
|
|
|
|
|
|
|
|
|
|
Oil and gas sales (a)
|
|
$
|
658
|
|
|
$
|
549
|
|
|
$
|
2,590
|
|
|
$
|
1,936
|
|
|
Net derivative gain (loss) from commodity contracts
|
|
260
|
|
|
(141
|
)
|
|
|
1
|
|
|
(90
|
)
|
|
|
Other revenue (a)
|
|
160
|
|
|
47
|
|
|
473
|
|
|
160
|
|
|
Total revenues and other
|
|
1,078
|
|
|
455
|
|
|
3,064
|
|
|
2,006
|
|
|
|
|
|
|
|
|
|
|
|
|
Costs and Other
|
|
|
|
|
|
|
|
|
|
Production costs
|
|
233
|
|
|
227
|
|
|
912
|
|
|
876
|
|
|
General and administrative expenses
|
|
65
|
|
|
66
|
|
|
299
|
|
|
249
|
|
|
Depreciation, depletion and amortization
|
|
130
|
|
|
132
|
|
|
502
|
|
|
544
|
|
|
Taxes other than on income
|
|
29
|
|
|
33
|
|
|
149
|
|
|
136
|
|
|
Exploration expense
|
|
16
|
|
|
5
|
|
|
34
|
|
|
22
|
|
|
Other expenses, net (a)
|
|
140
|
|
|
30
|
|
|
399
|
|
|
106
|
|
|
Total costs and other
|
|
613
|
|
|
493
|
|
|
2,295
|
|
|
1,933
|
|
|
|
|
|
|
|
|
|
|
|
|
Operating Income (Loss)
|
|
465
|
|
|
(38
|
)
|
|
|
769
|
|
|
73
|
|
|
|
|
|
|
|
|
|
|
|
|
Non-Operating (Loss) Income
|
|
|
|
|
|
|
|
|
|
Interest and debt expense, net
|
|
(98
|
)
|
|
|
(91
|
)
|
|
|
(379
|
)
|
|
|
(343
|
)
|
|
|
Net gain on early extinguishment of debt
|
|
31
|
|
|
—
|
|
|
57
|
|
|
4
|
|
|
Gain on asset divestitures
|
|
1
|
|
|
—
|
|
|
5
|
|
|
21
|
|
|
Other non-operating expenses
|
|
(7
|
)
|
|
|
(6
|
)
|
|
|
(23
|
)
|
|
|
(17
|
)
|
|
|
|
|
|
|
|
|
|
|
|
|
Income (Loss) Before Income Taxes
|
|
392
|
|
|
(135
|
)
|
|
|
429
|
|
|
(262
|
)
|
|
|
Income tax
|
|
—
|
|
|
—
|
|
|
—
|
|
|
—
|
|
|
Net Income (Loss)
|
|
392
|
|
|
(135
|
)
|
|
|
429
|
|
|
(262
|
)
|
|
|
Net income attributable to noncontrolling interests
|
|
(46
|
)
|
|
|
(3
|
)
|
|
|
(101
|
)
|
|
|
(4
|
)
|
|
|
Net Income (Loss) Attributable to Common Stock
|
|
$
|
346
|
|
|
$
|
(138
|
)
|
|
|
$
|
328
|
|
|
$
|
(266
|
)
|
|
|
|
|
|
|
|
|
|
|
|
|
Net income (loss) attributable to common stock per share - basic (b)
|
|
$
|
7.00
|
|
|
$
|
(3.23
|
)
|
|
|
$
|
6.77
|
|
|
$
|
(6.26
|
)
|
|
|
Net income (loss) attributable to common stock per share - diluted
|
|
$
|
7.00
|
|
|
$
|
(3.23
|
)
|
|
|
$
|
6.77
|
|
|
$
|
(6.26
|
)
|
|
|
|
|
|
|
|
|
|
|
|
|
Adjusted net income (loss)
|
|
$
|
26
|
|
|
$
|
(14
|
)
|
|
|
$
|
61
|
|
|
$
|
(187
|
)
|
|
|
Adjusted net income (loss) per share - basic (b)
|
|
$
|
0.53
|
|
|
$
|
(0.33
|
)
|
|
|
$
|
1.27
|
|
|
$
|
(4.40
|
)
|
|
|
Adjusted net income (loss) per share - diluted
|
|
$
|
0.53
|
|
|
$
|
(0.33
|
)
|
|
|
$
|
1.27
|
|
|
$
|
(4.40
|
)
|
|
|
|
|
|
|
|
|
|
|
|
|
Weighted-average common shares outstanding - basic
|
|
$
|
48.6
|
|
|
$
|
42.7
|
|
|
$
|
47.4
|
|
|
$
|
42.5
|
|
|
Weighted-average common shares outstanding - diluted
|
|
$
|
48.6
|
|
|
$
|
42.7
|
|
|
$
|
47.4
|
|
|
$
|
42.5
|
|
|
|
|
|
|
|
|
|
|
|
|
Adjusted EBITDAX
|
|
$
|
314
|
|
|
$
|
231
|
|
|
$
|
1,117
|
|
|
$
|
779
|
|
|
Effective tax rate
|
|
0
|
%
|
|
0
|
%
|
|
0
|
%
|
|
0
|
%
|
|
|
|
|
|
|
|
|
|
|
|
|
|
|
|
(a) We adopted a new revenue recognition standard on January 1, 2018
which required certain sales-related costs to be reported as expense
as opposed to being netted against revenue. The adoption of this
standard does not affect net income. Results for reporting periods
beginning January 1, 2018 are presented under the new accounting
standard while prior periods are not adjusted and continue to be
reported under accounting standards in effect for the applicable
period. Under prior accounting standards, for the three and twelve
months ended December 31, 2018, oil and gas sales would have been
$653 million and $2,568 million, respectively, other revenue would
have been $150 million and $392 million, respectively, and other
expenses, net would have been $125 million and $296 million,
respectively.
|
|
|
|
|
(b) In calculating Net income (loss) attributable to common stock
per share - basic, income of $6 million and $7 million for the three
and twelve months ended December 31, 2108, respectively, was
allocated to unvested participating securities with the balance of
undistributed earnings allocated to common shares. In calculating
Adjusted net income (loss) per share - basic, none and $1 million
for the three and twelve months ended December 31, 2018,
respectively, was allocated to unvested participating securities
with the balance of undistributed earnings allocated to common
shares. For periods of losses no allocation is made to participating
securities.
|
|
|
|
|
|
Fourth Quarter
|
|
Twelve Months
|
|
($ and shares in millions)
|
|
2018
|
|
2017
|
|
2018
|
|
2017
|
|
|
|
|
|
|
|
|
|
|
|
Cash Flow Data:
|
|
|
|
|
|
|
|
|
|
Net cash provided by operating activities
|
|
$
|
68
|
|
|
$
|
23
|
|
|
$
|
461
|
|
|
$
|
248
|
|
|
Net cash used in investing activities
|
|
$
|
(191
|
)
|
|
$
|
(139
|
)
|
|
$
|
(1,156
|
)
|
|
$
|
(313
|
)
|
|
Net cash provided by financing activities
|
|
$
|
109
|
|
|
$
|
108
|
|
|
$
|
692
|
|
|
$
|
73
|
|
|
|
|
|
|
|
|
|
|
|
|
Selected Balance Sheet Data:
|
|
December 31,
|
|
December 31,
|
|
|
|
|
|
|
|
2018
|
|
2017
|
|
|
|
|
|
Total current assets
|
|
$
|
640
|
|
|
$
|
483
|
|
|
|
|
|
|
Total property, plant and equipment, net
|
|
$
|
6,455
|
|
|
$
|
5,696
|
|
|
|
|
|
|
Total current liabilities
|
|
$
|
607
|
|
|
$
|
732
|
|
|
|
|
|
|
Long-term debt
|
|
$
|
5,251
|
|
|
$
|
5,306
|
|
|
|
|
|
|
Other long-term liabilities
|
|
$
|
575
|
|
|
$
|
602
|
|
|
|
|
|
|
Mezzanine equity
|
|
$
|
756
|
|
|
$
|
—
|
|
|
|
|
|
|
Equity
|
|
$
|
(247
|
)
|
|
$
|
(720
|
)
|
|
|
|
|
|
|
|
|
|
|
|
|
|
|
|
Outstanding shares as of
|
|
48.7
|
|
|
42.9
|
|
|
|
|
|
|
|
|
|
|
|
|
|
|
|
|
|
|
|
|
STOCK-BASED COMPENSATION
|
|
|
|
Our consolidated results of operations for the three and twelve
months ended December 31, 2018 include the effects of long- term
stock-based compensation plans under which we annually grant
awards to executives, non-executive employees and non-employee
directors that are either settled with shares of our common stock
or cash. Our equity-settled awards granted to executives include
stock options, restricted stock and performance stock units that
either cliff vest at the end of a three-year period or vest
ratably over a three-year period, some of which are partially
settled in cash. Our equity-settled awards granted to non-employee
directors are restricted stock units that cliff vest after one
year. Our cash-settled awards granted to non-executive employees
vest ratably over a three-year period.
|
|
|
|
Changes in our stock price introduces volatility in our income
statement because we pay partially or fully cash-settled awards
based on our stock price as of the vesting date and accounting rules
require that we adjust our obligation for such awards to the amount
that would be paid using our stock price as of the end of each
reporting period. Cash-settled awards, including executive awards
partially settled in cash, account for over 50% of our total
outstanding awards. The increase in our stock price in 2018 resulted
in higher cash-settled stock-based compensation expense in the
second and third quarters of 2018 when a portion of these awards
vested and our unvested awards were marked-to-market based on the
period-end stock price. In the fourth quarter of 2018, our stock
price declined and the year-end mark-to-market adjustments reduced
our compensation expense. Equity-settled awards are not similarly
adjusted for changes in our stock price.
|
|
|
|
Stock-based compensation is included in both general and
administrative expenses and production costs as shown in the table
below:
|
|
|
|
Fourth Quarter
|
|
Twelve Months
|
|
($ in millions, except per BOE amounts)
|
|
2018
|
|
2017
|
|
2018
|
|
2017
|
|
|
|
|
|
|
|
|
|
|
|
Expense (Income)
|
|
|
|
|
|
|
|
|
|
|
|
|
|
|
|
|
|
|
|
General and administrative expenses
|
|
|
|
|
|
|
|
|
|
Cash-settled awards
|
|
$
|
(10
|
)
|
|
$
|
6
|
|
|
$
|
23
|
|
|
$
|
9
|
|
Equity-settled awards
|
|
2
|
|
|
3
|
|
|
13
|
|
|
14
|
|
Total stock-based compensation in G&A
|
|
$
|
(8
|
)
|
|
$
|
9
|
|
|
$
|
36
|
|
|
$
|
23
|
|
Total stock-based compensation in G&A per Boe
|
|
$
|
(0.64
|
)
|
|
$
|
0.78
|
|
|
$
|
0.75
|
|
|
$
|
0.49
|
|
|
|
|
|
|
|
|
|
|
|
Production costs
|
|
|
|
|
|
|
|
|
|
Cash-settled awards
|
|
$
|
(2
|
)
|
|
$
|
2
|
|
|
$
|
6
|
|
|
$
|
2
|
|
Equity-settled awards
|
|
—
|
|
|
—
|
|
|
3
|
|
|
4
|
|
Total stock-based compensation in production costs
|
|
$
|
(2
|
)
|
|
$
|
2
|
|
|
$
|
9
|
|
|
$
|
6
|
|
Total stock-based compensation in production costs per Boe
|
|
$
|
(0.16
|
)
|
|
$
|
0.17
|
|
|
$
|
0.19
|
|
|
$
|
0.13
|
|
|
|
|
|
|
|
|
|
|
|
Total company stock-based compensation
|
|
$
|
(10
|
)
|
|
$
|
11
|
|
|
$
|
45
|
|
|
$
|
29
|
|
Total company stock-based compensation per Boe
|
|
$
|
(0.80
|
)
|
|
$
|
0.95
|
|
|
$
|
0.94
|
|
|
$
|
0.62
|
|
|
|
|
|
|
|
|
|
|
|
|
|
|
|
|
|
|
|
|
|
|
|
|
|
|
|
|
Attachment 2
|
|
PRODUCTION STATISTICS
|
|
|
|
|
|
|
|
|
|
|
|
|
|
|
|
|
|
Fourth Quarter
|
|
Twelve Months
|
|
Net Oil, NGLs and Natural Gas Production Per Day
|
|
2018
|
|
2017
|
|
2018
|
|
2017
|
|
|
|
|
|
|
|
|
|
|
|
Oil (MBbl/d)
|
|
|
|
|
|
|
|
|
|
San Joaquin Basin
|
|
56
|
|
|
50
|
|
|
53
|
|
|
52
|
|
Los Angeles Basin
|
|
26
|
|
|
26
|
|
|
25
|
|
|
27
|
|
Ventura Basin
|
|
4
|
|
|
4
|
|
|
4
|
|
|
4
|
|
Total
|
|
86
|
|
|
80
|
|
|
82
|
|
|
83
|
|
|
|
|
|
|
|
|
|
|
|
NGLs (MBbl/d)
|
|
|
|
|
|
|
|
|
|
San Joaquin Basin
|
|
15
|
|
|
15
|
|
|
15
|
|
|
15
|
|
Ventura Basin
|
|
1
|
|
|
1
|
|
|
1
|
|
|
1
|
|
Total
|
|
16
|
|
|
16
|
|
|
16
|
|
|
16
|
|
|
|
|
|
|
|
|
|
|
|
Natural Gas (MMcf/d)
|
|
|
|
|
|
|
|
|
|
San Joaquin Basin
|
|
168
|
|
|
138
|
|
|
165
|
|
|
140
|
|
Los Angeles Basin
|
|
2
|
|
|
1
|
|
|
1
|
|
|
1
|
|
Ventura Basin
|
|
7
|
|
|
7
|
|
|
7
|
|
|
8
|
|
Sacramento Basin
|
|
27
|
|
|
33
|
|
|
29
|
|
|
33
|
|
Total
|
|
204
|
|
|
179
|
|
|
202
|
|
|
182
|
|
|
|
|
|
|
|
|
|
|
|
Total Production (MBoe/d) (a)
|
|
136
|
|
|
126
|
|
|
132
|
|
|
129
|
|
|
|
|
|
|
|
|
|
|
|
|
|
|
Note: MBbl/d refers to thousands of barrels per day; MMcf/d refers
to millions of cubic feet per day; MBoe/d refers to thousands of
barrels of oil equivalent per day.
|
|
|
|
|
(a) Natural gas volumes have been converted to BOE based on the
equivalence of energy content between six Mcf of natural gas and one
Bbl of oil. Barrels of oil equivalence does not necessarily result
in price equivalence.
|
|
|
|
Attachment 3
|
|
NON-GAAP FINANCIAL MEASURES AND RECONCILIATIONS
|
|
|
|
Our results of operations can include the effects of unusual,
out-of-period and infrequent transactions and events affecting
earnings that vary widely and unpredictably (in particular certain
non-cash items such as derivative gains and losses) in nature,
timing, amount and frequency. Therefore, management uses a measure
called adjusted net income (loss) which excludes those items. This
measure is not meant to disassociate items from management's
performance, but rather is meant to provide useful information to
investors interested in comparing our performance between periods.
Reported earnings are considered representative of management's
performance over the long term. Adjusted net income (loss) is not
considered to be an alternative to net income (loss) reported in
accordance with U.S. generally accepted accounting principles (GAAP).
|
|
|
|
We define certain of our non-GAAP financial measures as follows:
|
|
|
|
(1) Adjusted EBITDAX is calculated as earnings before interest
expense; income taxes; depreciation, depletion and amortization;
exploration expense; other unusual, out-of-period and infrequent
items; and other non-cash items.
|
|
|
|
(2) Core Adjusted EBITDAX removes the transitory effects of settled
hedges and cash-settled stock-based compensation expense from
Adjusted EBITDAX.
|
|
|
|
(3) Free Cash Flow is net cash provided by operating activities
after our internal capital investment.
|
|
|
|
(4) Discretionary Cash Flow is the cash available after payments to
our noncontrolling interest holders and cash interest, excluding the
effect of working capital changes but before our internal capital
investment.
|
|
|
|
We believe these measures provide useful information in assessing
our financial condition, results of operations and cash flows and
are widely used by the industry, the investment community and our
lenders. Although these are non-GAAP measures, the amounts included
in the calculations were computed in accordance with GAAP. Certain
items excluded from these non-GAAP measures are significant
components in understanding and assessing our financial performance,
such as our cost of capital and tax structure, as well as the
historic cost of depreciable and depletable assets. These measures
should be read in conjunction with the information contained in our
financial statements prepared in accordance with GAAP. A version of
Adjusted EBITDAX is a material component of certain of our financial
covenants under our 2014 Revolving Credit Facility and is provided
in addition to, and not as an alternative for, income and liquidity
measures calculated in accordance with GAAP.
|
|
|
|
|
|
ADJUSTED NET INCOME (LOSS)
|
|
|
|
The following table presents a reconciliation of the GAAP financial
measure of net income (loss) attributable to common stock to the
non-GAAP financial measure of adjusted net income (loss) and
presents the GAAP financial measure of net income (loss)
attributable to common stock per diluted share and the non-GAAP
financial measure of adjusted net income (loss) per diluted share:
|
|
|
|
|
|
|
|
|
|
Fourth Quarter
|
|
Twelve Months
|
|
($ millions, except per share amounts)
|
|
2018
|
|
2017
|
|
2018
|
|
2017
|
|
Net income (loss)
|
|
$
|
392
|
|
|
$
|
(135
|
)
|
|
$
|
429
|
|
|
$
|
(262
|
)
|
|
Net income attributable to noncontrolling interests
|
|
(46
|
)
|
|
(3
|
)
|
|
(101
|
)
|
|
(4
|
)
|
|
Net income (loss) attributable to common stock
|
|
346
|
|
|
(138
|
)
|
|
328
|
|
|
(266
|
)
|
|
Unusual, infrequent and other items:
|
|
|
|
|
|
|
|
|
|
Non-cash derivative (gain) loss from commodities excluding
noncontrolling interest
|
|
(295
|
)
|
|
116
|
|
|
(224
|
)
|
|
78
|
|
|
Non-cash derivative loss from interest-rate contracts
|
|
6
|
|
|
—
|
|
|
6
|
|
|
—
|
|
|
Early retirement and severance costs
|
|
—
|
|
|
1
|
|
|
4
|
|
|
5
|
|
|
Gain on asset divestitures
|
|
(1
|
)
|
|
—
|
|
|
(5
|
)
|
|
(21
|
)
|
|
Net gain on early extinguishment of debt
|
|
(31
|
)
|
|
—
|
|
|
(57
|
)
|
|
(4
|
)
|
|
Other, net
|
|
1
|
|
|
7
|
|
|
9
|
|
|
21
|
|
|
Total unusual, infrequent and other items
|
|
(320
|
)
|
|
124
|
|
|
(267
|
)
|
|
79
|
|
|
|
|
|
|
|
|
|
|
|
|
Adjusted net income (loss)
|
|
$
|
26
|
|
|
$
|
(14
|
)
|
|
$
|
61
|
|
|
$
|
(187
|
)
|
|
|
|
|
|
|
|
|
|
|
|
Net income (loss) attributable to common stock per share - diluted
|
|
$
|
7.00
|
|
|
$
|
(3.23
|
)
|
|
$
|
6.77
|
|
|
$
|
(6.26
|
)
|
|
Adjusted net income (loss) per share - diluted
|
|
$
|
0.53
|
|
|
$
|
(0.33
|
)
|
|
$
|
1.27
|
|
|
$
|
(4.40
|
)
|
|
|
|
|
|
|
|
|
|
|
|
|
|
|
|
|
|
|
|
|
|
|
|
|
|
|
|
|
|
|
|
|
|
|
|
|
|
|
|
|
|
DERIVATIVE GAINS AND LOSSES
|
|
|
|
|
|
|
|
Fourth Quarter
|
|
Twelve Months
|
|
($ millions)
|
|
2018
|
|
2017
|
|
2018
|
|
2017
|
|
Commodity Contracts:
|
|
|
|
|
|
|
|
|
|
Non-cash derivative gain (loss) excluding noncontrolling interest
|
|
$
|
295
|
|
|
$
|
(116
|
)
|
|
$
|
224
|
|
|
$
|
(78
|
)
|
|
Non-cash derivative gain (loss) included in noncontrolling interest
|
|
15
|
|
|
(3
|
)
|
|
5
|
|
|
(5
|
)
|
|
Net payments on settled commodity derivatives
|
|
(50
|
)
|
|
(22
|
)
|
|
(228
|
)
|
|
(7
|
)
|
|
Net derivative gain (loss) from commodity contracts
|
|
$
|
260
|
|
|
$
|
(141
|
)
|
|
$
|
1
|
|
|
$
|
(90
|
)
|
|
|
|
|
|
|
|
|
|
|
|
Interest Rate Contracts:
|
|
|
|
|
|
|
|
|
|
Non-cash derivative loss
|
|
$
|
(6
|
)
|
|
$
|
—
|
|
|
$
|
(6
|
)
|
|
$
|
—
|
|
|
|
|
|
|
|
|
|
|
|
|
|
|
|
|
|
|
|
|
|
|
FREE CASH FLOW
|
|
|
|
|
|
|
|
|
|
|
|
Fourth Quarter
|
|
Twelve Months
|
|
($ millions)
|
|
2018
|
|
2017
|
|
2018
|
|
2017
|
|
|
|
|
|
|
|
|
|
|
|
Net cash provided by operating activities
|
|
$
|
68
|
|
|
$
|
23
|
|
|
$
|
461
|
|
|
$
|
248
|
|
|
Capital investment
|
|
(186
|
)
|
|
(139
|
)
|
|
(690
|
)
|
|
(371
|
)
|
|
Free cash flow
|
|
(118
|
)
|
|
(116
|
)
|
|
(229
|
)
|
|
(123
|
)
|
|
BSP funded capital investment
|
|
12
|
|
|
14
|
|
|
49
|
|
|
96
|
|
|
Free cash flow excluding BSP funded capital
|
|
$
|
(106
|
)
|
|
$
|
(102
|
)
|
|
$
|
(180
|
)
|
|
$
|
(27
|
)
|
|
|
|
|
|
|
|
|
|
|
|
|
|
|
|
|
|
|
|
|
|
DISCRETIONARY CASH FLOW
|
|
|
|
|
|
|
|
|
|
|
|
Fourth Quarter
|
|
Twelve Months
|
|
($ millions)
|
|
2018
|
|
2017
|
|
2018
|
|
2017
|
|
Adjusted EBITDAX
|
|
$
|
314
|
|
|
$
|
231
|
|
|
$
|
1,117
|
|
|
$
|
779
|
|
|
|
|
|
|
|
|
|
|
|
|
Cash Interest
|
|
(157
|
)
|
|
(145
|
)
|
|
(441
|
)
|
|
(396
|
)
|
|
Distributions to noncontrolling interest holders:
|
|
|
|
|
|
|
|
|
|
BSP joint venture
|
|
(21
|
)
|
|
(2
|
)
|
|
(56
|
)
|
|
(8
|
)
|
|
Ares joint venture
|
|
(20
|
)
|
|
—
|
|
|
(65
|
)
|
|
—
|
|
|
|
|
|
|
|
|
|
|
|
|
Discretionary Cash Flow
|
|
$
|
116
|
|
|
$
|
84
|
|
|
$
|
555
|
|
|
$
|
375
|
|
|
|
|
|
|
|
|
|
|
|
|
|
|
|
|
|
|
|
|
|
|
|
ADJUSTED EBITDAX AND CORE ADJUSTED EBITDAX
|
|
|
|
The following tables present a reconciliation of the GAAP financial
measures of net income (loss) and net cash provided (used) by
operating activities to the non-GAAP financial measures of adjusted
and core adjusted EBITDAX.
|
|
|
|
|
|
|
|
|
|
Fourth Quarter
|
|
Twelve Months
|
|
($ millions)
|
|
2018
|
|
2017
|
|
2018
|
|
2017
|
|
Net income (loss)
|
|
$
|
392
|
|
|
$
|
(135
|
)
|
|
$
|
429
|
|
|
$
|
(262
|
)
|
|
Interest and debt expense, net
|
|
98
|
|
|
91
|
|
|
379
|
|
|
343
|
|
|
Depreciation, depletion and amortization
|
|
130
|
|
|
132
|
|
|
502
|
|
|
544
|
|
|
Exploration expense
|
|
16
|
|
|
5
|
|
|
34
|
|
|
22
|
|
|
Unusual, infrequent and other items (a)
|
|
(320
|
)
|
|
124
|
|
|
(267
|
)
|
|
79
|
|
|
Other non-cash items
|
|
(2
|
)
|
|
14
|
|
|
40
|
|
|
53
|
|
|
Adjusted EBITDAX
|
|
$
|
314
|
|
|
$
|
231
|
|
|
$
|
1,117
|
|
|
$
|
779
|
|
|
Net payments on settled commodity derivatives
|
|
50
|
|
|
22
|
|
|
228
|
|
|
7
|
|
|
Cash-settled stock-based compensation
|
|
(12
|
)
|
|
8
|
|
|
29
|
|
|
11
|
|
|
Core Adjusted EBITDAX
|
|
$
|
352
|
|
|
$
|
261
|
|
|
$
|
1,374
|
|
|
$
|
797
|
|
|
|
|
|
|
|
|
|
|
|
|
Net cash provided by operating activities
|
|
$
|
68
|
|
|
$
|
23
|
|
|
$
|
461
|
|
|
$
|
248
|
|
|
Cash interest
|
|
157
|
|
|
145
|
|
|
441
|
|
|
396
|
|
|
Exploration expenditures
|
|
3
|
|
|
4
|
|
|
17
|
|
|
20
|
|
|
Working capital changes
|
|
86
|
|
|
52
|
|
|
199
|
|
|
94
|
|
|
Other, net
|
|
—
|
|
|
7
|
|
|
(1
|
)
|
|
21
|
|
|
Adjusted EBITDAX
|
|
$
|
314
|
|
|
$
|
231
|
|
|
$
|
1,117
|
|
|
$
|
779
|
|
|
Net payments on settled commodity derivatives
|
|
50
|
|
|
22
|
|
|
228
|
|
|
7
|
|
|
Cash-settled stock-based compensation
|
|
(12
|
)
|
|
8
|
|
|
29
|
|
|
11
|
|
|
Core Adjusted EBITDAX
|
|
$
|
352
|
|
|
$
|
261
|
|
|
$
|
1,374
|
|
|
$
|
797
|
|
|
|
|
|
|
|
|
|
|
|
|
(a) See Adjusted Net Income (Loss) reconciliation.
|
|
|
|
|
|
|
|
|
|
|
|
|
|
|
|
|
|
|
|
|
|
ADJUSTED EBITDAX MARGIN
|
|
|
|
|
|
|
|
Fourth Quarter
|
|
Twelve Months
|
|
($ millions)
|
|
2018
|
|
2017
|
|
2018
|
|
2017
|
|
Total revenues and other
|
|
$
|
1,078
|
|
|
$
|
455
|
|
|
$
|
3,064
|
|
|
$
|
2,006
|
|
|
Non-cash derivative (gain) loss
|
|
(310
|
)
|
|
119
|
|
|
(229
|
)
|
|
83
|
|
|
Adjusted revenues
|
|
$
|
768
|
|
|
$
|
574
|
|
|
$
|
2,835
|
|
|
$
|
2,089
|
|
|
Adjusted EBITDAX Margin (b)
|
|
41
|
%
|
|
40
|
%
|
|
39
|
%
|
|
37
|
%
|
|
|
|
|
|
|
|
|
|
|
|
|
|
|
|
(b) See Note (a) on Attachment 1 related to our adoption of a new
revenue recognition standard for the reporting of certain
sales-related costs. Under prior accounting standards, for the three
and twelve months ended December 31, 2018, the adjusted EBITDAX
margin would have been 42% and 41% respectively.
|
|
|
|
|
|
|
|
|
|
|
|
|
|
PRODUCTION COSTS PER BOE
|
|
|
|
|
|
|
|
|
|
|
|
Fourth Quarter
|
|
Twelve Months
|
|
($ per Boe)
|
|
2018
|
|
2017
|
|
2018
|
|
2017
|
|
Production costs
|
|
$
|
18.61
|
|
|
$
|
19.64
|
|
|
$
|
18.88
|
|
|
$
|
18.64
|
|
|
Excess costs attributable to PSC-type contracts
|
|
(1.17
|
)
|
|
(1.33
|
)
|
|
(1.41
|
)
|
|
(1.16
|
)
|
|
Production costs, excluding effects of PSC-type contracts
|
|
$
|
17.44
|
|
|
$
|
18.31
|
|
|
$
|
17.47
|
|
|
$
|
17.48
|
|
|
|
|
|
|
|
|
|
|
|
|
|
|
|
|
|
|
|
|
|
|
|
PV-10 AND STANDARDIZED MEASURE
|
|
|
The following table presents a reconciliation of the GAAP financial
measure of standardized measure of discounted future net cash flows
to the non-GAAP financial measure of PV-10:
|
|
($ millions)
|
|
|
|
|
|
2018
|
|
Standardized measure of discounted future net cash flows
|
|
|
|
$
|
7,275
|
|
Present value of future income taxes discounted at 10%
|
|
|
|
2,136
|
|
PV-10 of proved reserves (1)
|
|
|
|
|
|
$
|
9,411
|
|
|
|
|
|
|
|
|
|
|
(1) PV-10 is a non-GAAP financial measure and represents the
year-end present value of estimated future cash inflows from proved
oil and natural gas reserves, less future development and production
costs, discounted at 10% per annum to reflect the timing of future
cash flows and using SEC prescribed pricing assumptions for the
period. PV-10 differs from Standardized Measure because Standardized
Measure includes the effects of future income taxes on future net
cash flows. Neither PV-10 nor Standardized Measure should be
construed as the fair value of our oil and natural gas reserves.
Standard Measure is prescribed by the SEC as an industry standard
asset value measure to compare reserves with consistent pricing,
costs and discount assumptions. PV-10 facilitates the comparisons to
other companies as it is not dependent on the tax-paying status of
the entity.
|
|
|
|
|
|
Attachment 4
|
|
|
|
|
Reserve Replacement Ratios (1)
|
|
|
|
|
|
2018
|
|
Organic Reserve Replacement Ratio (2)
|
|
|
|
|
|
|
|
|
Extensions and discoveries
|
|
|
|
|
|
30
|
|
|
Improved recovery
|
|
|
|
|
|
4
|
|
|
Revisions related to performance (excluding discretionary PUD
downgrades)
|
|
27
|
|
|
Organic proved reserves added - MMBOE (A)
|
|
|
|
|
|
61
|
|
|
|
|
|
|
|
|
|
|
|
Production in 2018 - MMBOE (B)
|
|
|
|
|
|
48
|
|
|
Organic reserve replacement ratio (A)/(B)
|
|
|
|
|
|
127
|
%
|
|
|
|
|
|
|
|
|
|
|
All-in Reserve Replacement Ratio (3)
|
|
|
|
|
|
|
|
|
Extensions and discoveries
|
|
|
|
|
|
30
|
|
|
Improved recovery
|
|
|
|
|
|
4
|
|
|
Purchases of proved reserves
|
|
|
|
|
|
64
|
|
|
Revisions related to performance
|
|
|
|
|
|
6
|
|
|
Revisions related to price
|
|
|
|
|
|
38
|
|
|
All-in proved reserves added - MMBOE (C)
|
|
|
|
|
|
142
|
|
|
|
|
|
|
|
|
|
|
|
Production in 2018 - MMBOE (D)
|
|
|
|
|
|
48
|
|
|
All-in reserve replacement ratio (C)/(D)
|
|
|
|
|
|
296
|
%
|
|
|
|
|
|
|
|
|
|
|
(1) The reserve replacement ratio is a non-GAAP measure that
management uses to gauge the results of its capital program. There
is no guarantee that historical sources of reserve additions will
continue as many factors fully or partially outside management's
control, including commodity prices, availability of capital and the
underlying geology, affect reserves additions. Other oil and gas
producers may use different methods to calculate replacement ratios,
which may affect comparability.
|
|
|
|
|
(2) The organic reserve replacement ratio is calculated for a
specified period using the proved oil-equivalent additions from
extensions and discoveries, improved recovery and
performance-related revisions (excluding 21 MMBOE of proved
undeveloped reserves downgraded at management's discretion), divided
by oil-equivalent production.
|
|
|
|
|
(3) The all-in reserve replacement ratio is calculated for a
specified period using the proved oil-equivalent additions from
extensions and discoveries, improved recovery, revisions and
purchases, divided by oil-equivalent production.
|
|
|
|
Finding and Development Costs(4)
|
|
|
|
|
|
2018
|
|
|
Exploration and development costs - in millions (A)
|
|
$
|
690
|
|
|
|
Property acquisition costs - in millions
|
|
554
|
|
|
|
Total costs incurred - in millions (B)
|
|
$
|
1,244
|
|
|
|
|
|
|
|
|
Organic proved reserves added - MMBOE (C)
|
|
61
|
|
|
|
Organic finding and development costs - $/BOE (A)/(C)
|
|
$
|
11.31
|
|
(5)
|
|
|
|
|
|
|
|
|
|
|
Total reserve replacements - MMBOE (D)
|
|
142
|
|
|
|
All-in finding and development costs - $/BOE (B)/(D)
|
|
|
|
|
|
$
|
8.76
|
|
(6)
|
|
|
|
|
|
|
|
|
|
|
|
|
(4) We believe that reporting our finding and development costs can
aid investors in their evaluation of our ability to add proved
reserves at a reasonable cost but is not a substitute for required
GAAP disclosures. Various factors, primarily timing differences and
effects of commodity price changes, can cause finding and
development costs associated with a particular period's reserves
additions to be imprecise. For example, we will need to make more
investments in order to develop the proved undeveloped reserves
added during the year and any future revisions may change the actual
measure from that presented above. In addition, part of the 2018
costs were incurred to convert proved undeveloped reserves from
prior years to proved developed reserves. In our calculations, we
have not estimated future costs to develop proved undeveloped
reserves added in 2018 or removed costs related to proved
undeveloped reserves added in prior periods. Our calculations of
finding and development costs may not be comparable to similar
measures provided by other companies.
|
|
|
|
|
(5) We calculate organic finding and development costs by dividing
the costs incurred for the year from the capital program by the
amount of oil-equivalent proved reserves added in the same year from
improved recovery, extensions and discoveries and
performance-related revisions (excluding 21 MMBOE of proved
undeveloped reserves downgraded at management's discretion).
|
|
|
|
|
(6) We calculate all-in finding and development costs by dividing
the costs incurred for the year by the amount of oil-equivalent
proved reserves added in the same year from improved recovery,
extensions and discoveries, revisions and purchases.
|
|
|
|
|
|
Attachment 5
|
|
ADJUSTED NET INCOME (LOSS) VARIANCE ANALYSIS
|
|
($ millions)
|
|
|
|
|
|
|
|
|
|
2017 4th Quarter Adjusted Net Loss
|
|
$
|
(14
|
)
|
|
|
|
|
|
|
|
Price - Oil
|
|
19
|
|
(a)
|
|
Price - NGLs
|
|
(1
|
)
|
|
|
Price - Natural Gas
|
|
15
|
|
(a)
|
|
Volume
|
|
37
|
|
|
|
Production costs
|
|
(6
|
)
|
|
|
Taxes other than on income
|
|
4
|
|
|
|
DD&A rate
|
|
11
|
|
|
|
Interest expense
|
|
(7
|
)
|
|
|
Adjusted general & administrative expenses
|
|
1
|
|
|
|
Net income attributable to noncontrolling interests
|
|
(43
|
)
|
|
|
Other
|
|
10
|
|
|
|
|
|
|
|
|
2018 4th Quarter Adjusted Net Income
|
|
$
|
26
|
|
|
|
|
|
|
|
|
|
|
|
|
|
2017 Twelve-Month Adjusted Net Loss
|
|
$
|
(187
|
)
|
|
|
|
|
|
|
|
Price - Oil
|
|
342
|
|
(a)
|
|
Price - NGLs
|
|
47
|
|
|
|
Price - Natural Gas
|
|
19
|
|
(a)
|
|
Volume
|
|
13
|
|
|
|
Production costs
|
|
(36
|
)
|
|
|
Taxes other than on income
|
|
(13
|
)
|
|
|
DD&A rate
|
|
53
|
|
|
|
Interest expense
|
|
(36
|
)
|
|
|
Adjusted general & administrative expenses
|
|
(49
|
)
|
|
|
Net income attributable to noncontrolling interests
|
|
(97
|
)
|
|
|
Other
|
|
5
|
|
|
|
|
|
|
|
|
2018 Twelve-Month Adjusted Net Income
|
|
$
|
61
|
|
|
|
|
|
|
|
|
(a) Includes cash settlements on commodity derivatives.
|
|
|
|
|
|
Attachment 6
|
|
CAPITAL INVESTMENTS
|
|
|
|
|
|
|
|
|
|
|
|
Fourth Quarter
|
|
Twelve Months
|
|
($ millions)
|
|
2018
|
|
2017
|
|
2018
|
|
2017
|
|
|
|
|
|
|
|
|
|
|
|
Internally Funded Capital
|
|
$
|
174
|
|
|
$
|
125
|
|
|
$
|
641
|
|
|
$
|
275
|
|
|
|
|
|
|
|
|
|
|
|
BSP Funded Capital
|
|
12
|
|
|
14
|
|
|
49
|
|
|
96
|
|
|
|
|
|
|
|
|
|
|
|
Consolidated Reported Capital Investments
|
|
$
|
186
|
|
|
$
|
139
|
|
|
$
|
690
|
|
|
$
|
371
|
|
|
|
|
|
|
|
|
|
|
|
MIRA Funded Capital
|
|
11
|
|
|
20
|
|
|
57
|
|
|
58
|
|
|
|
|
|
|
|
|
|
|
|
Total Capital Program
|
|
$
|
197
|
|
|
$
|
159
|
|
|
$
|
747
|
|
|
$
|
429
|
|
|
|
|
|
|
|
|
|
|
|
|
|
|
|
|
|
|
|
|
|
|
|
|
|
|
|
|
|
|
|
|
|
|
|
|
Attachment 7
|
|
PRICE STATISTICS
|
|
|
|
|
|
|
|
|
|
|
|
Fourth Quarter
|
|
Twelve Months
|
|
|
|
2018
|
|
2017
|
|
2018
|
|
2017
|
|
Realized Prices
|
|
|
|
|
|
|
|
|
|
Oil with hedge ($/Bbl)
|
|
$
|
59.97
|
|
|
$
|
56.92
|
|
|
$
|
62.60
|
|
|
$
|
51.24
|
|
|
Oil without hedge ($/Bbl)
|
|
$
|
66.12
|
|
|
$
|
59.87
|
|
|
$
|
70.11
|
|
|
$
|
51.47
|
|
|
|
|
|
|
|
|
|
|
|
|
NGLs ($/Bbl)
|
|
$
|
43.56
|
|
|
$
|
44.03
|
|
|
$
|
43.67
|
|
|
$
|
35.76
|
|
|
|
|
|
|
|
|
|
|
|
|
Natural gas ($/Mcf) (a)
|
|
$
|
3.77
|
|
|
$
|
2.77
|
|
|
$
|
3.00
|
|
|
$
|
2.67
|
|
|
|
|
|
|
|
|
|
|
|
|
Index Prices
|
|
|
|
|
|
|
|
|
|
Brent oil ($/Bbl)
|
|
$
|
68.08
|
|
|
$
|
61.54
|
|
|
$
|
71.53
|
|
|
$
|
54.82
|
|
|
WTI oil ($/Bbl)
|
|
$
|
58.81
|
|
|
$
|
55.40
|
|
|
$
|
64.77
|
|
|
$
|
50.95
|
|
|
NYMEX gas ($/MMBtu)
|
|
$
|
3.40
|
|
|
$
|
3.00
|
|
|
$
|
2.97
|
|
|
$
|
3.09
|
|
|
|
|
|
|
|
|
|
|
|
|
Realized Prices as Percentage of Index Prices
|
|
|
|
|
|
|
|
|
|
Oil with hedge as a percentage of Brent
|
|
88
|
%
|
|
92
|
%
|
|
88
|
%
|
|
93
|
%
|
|
Oil without hedge as a percentage of Brent
|
|
97
|
%
|
|
97
|
%
|
|
98
|
%
|
|
94
|
%
|
|
|
|
|
|
|
|
|
|
|
|
Oil with hedge as a percentage of WTI
|
|
102
|
%
|
|
103
|
%
|
|
97
|
%
|
|
101
|
%
|
|
Oil without hedge as a percentage of WTI
|
|
112
|
%
|
|
108
|
%
|
|
108
|
%
|
|
101
|
%
|
|
|
|
|
|
|
|
|
|
|
|
NGLs as a percentage of Brent
|
|
64
|
%
|
|
72
|
%
|
|
61
|
%
|
|
65
|
%
|
|
NGLs as a percentage of WTI
|
|
74
|
%
|
|
79
|
%
|
|
67
|
%
|
|
70
|
%
|
|
|
|
|
|
|
|
|
|
|
|
Natural gas as a percentage of NYMEX (a)
|
|
111
|
%
|
|
92
|
%
|
|
101
|
%
|
|
86
|
%
|
|
|
|
|
|
|
|
|
|
|
|
|
|
|
|
(a) See Note (a) on Attachment 1 related to our adoption of a new
accounting standard regarding the reporting of certain sales related
costs. For the three months and twelve months ended December 31,
2018, the realized gas price would have been $3.59 per Mcf and $2.79
per Mcf, respectively, and the realized gas price as a percentage of
NYMEX would have been 106% and 94%, respectively.
|
|
|
|
|
|
|
|
|
|
|
|
|
|
|
|
|
|
|
|
|
|
|
|
|
|
Attachment 8
|
|
FOURTH QUARTER DRILLING ACTIVITY
|
|
|
|
|
|
|
|
|
|
|
|
|
|
San Joaquin
|
|
Los Angeles
|
|
Ventura
|
|
Sacramento
|
|
|
|
Wells Drilled (Gross)
|
|
Basin
|
|
Basin
|
|
Basin
|
|
Basin
|
|
Total
|
|
|
|
|
|
|
|
|
|
|
|
|
|
Development Wells
|
|
|
|
|
|
|
|
|
|
|
|
Primary
|
|
12
|
|
—
|
|
—
|
|
—
|
|
12
|
|
Waterflood
|
|
19
|
|
16
|
|
3
|
|
—
|
|
38
|
|
Steamflood
|
|
33
|
|
—
|
|
—
|
|
—
|
|
33
|
|
Unconventional
|
|
7
|
|
—
|
|
—
|
|
—
|
|
7
|
|
Total
|
|
71
|
|
16
|
|
3
|
|
—
|
|
90
|
|
|
|
|
|
|
|
|
|
|
|
|
|
Exploration Wells
|
|
|
|
|
|
|
|
|
|
|
|
Primary
|
|
—
|
|
—
|
|
1
|
|
—
|
|
1
|
|
Waterflood
|
|
—
|
|
—
|
|
—
|
|
—
|
|
—
|
|
Steamflood
|
|
—
|
|
—
|
|
—
|
|
—
|
|
—
|
|
Unconventional
|
|
—
|
|
—
|
|
—
|
|
—
|
|
—
|
|
Total
|
|
—
|
|
—
|
|
1
|
|
—
|
|
1
|
|
|
|
|
|
|
|
|
|
|
|
|
|
Total Wells (a)
|
|
71
|
|
16
|
|
4
|
|
—
|
|
91
|
|
|
|
|
|
|
|
|
|
|
|
|
|
CRC Wells Drilled
|
|
69
|
|
13
|
|
4
|
|
—
|
|
86
|
|
|
|
|
|
|
|
|
|
|
|
|
|
BSP Wells Drilled
|
|
—
|
|
3
|
|
—
|
|
—
|
|
3
|
|
|
|
|
|
|
|
|
|
|
|
|
|
MIRA Wells Drilled
|
|
2
|
|
—
|
|
—
|
|
—
|
|
2
|
|
|
|
|
|
|
|
|
|
|
|
|
|
(a) Includes steam injectors and drilled but uncompleted
wells, which would not be included in the SEC definition of wells
drilled.
|
|
|
|
|
|
|
|
|
|
|
|
|
|
|
|
|
|
|
|
|
|
|
|
|
|
Attachment 9
|
|
FULL YEAR DRILLING ACTIVITY
|
|
|
|
|
|
|
|
|
|
|
|
|
|
San Joaquin
|
|
Los Angeles
|
|
Ventura
|
|
Sacramento
|
|
|
|
Wells Drilled (Gross)
|
|
Basin
|
|
Basin
|
|
Basin
|
|
Basin
|
|
Total
|
|
|
|
|
|
|
|
|
|
|
|
|
|
Development Wells
|
|
|
|
|
|
|
|
|
|
|
|
Primary
|
|
33
|
|
—
|
|
—
|
|
—
|
|
33
|
|
Waterflood
|
|
36
|
|
52
|
|
3
|
|
—
|
|
91
|
|
Steamflood
|
|
182
|
|
—
|
|
—
|
|
—
|
|
182
|
|
Unconventional
|
|
33
|
|
—
|
|
—
|
|
—
|
|
33
|
|
Total
|
|
284
|
|
52
|
|
3
|
|
—
|
|
339
|
|
|
|
|
|
|
|
|
|
|
|
|
|
Exploration Wells
|
|
|
|
|
|
|
|
|
|
|
|
Primary
|
|
2
|
|
—
|
|
2
|
|
—
|
|
4
|
|
Waterflood
|
|
—
|
|
—
|
|
—
|
|
—
|
|
—
|
|
Steamflood
|
|
—
|
|
—
|
|
—
|
|
—
|
|
—
|
|
Unconventional
|
|
—
|
|
—
|
|
—
|
|
—
|
|
—
|
|
Total
|
|
2
|
|
—
|
|
2
|
|
—
|
|
4
|
|
|
|
|
|
|
|
|
|
|
|
|
|
Total Wells (a)
|
|
286
|
|
52
|
|
5
|
|
—
|
|
343
|
|
|
|
|
|
|
|
|
|
|
|
|
|
CRC Wells Drilled
|
|
190
|
|
42
|
|
5
|
|
—
|
|
237
|
|
|
|
|
|
|
|
|
|
|
|
|
|
BSP Wells Drilled
|
|
5
|
|
10
|
|
—
|
|
—
|
|
15
|
|
|
|
|
|
|
|
|
|
|
|
|
|
MIRA Wells Drilled
|
|
91
|
|
—
|
|
—
|
|
—
|
|
91
|
|
|
|
|
|
|
|
|
|
|
|
|
|
(a) Includes steam injectors and drilled but uncompleted
wells, which would not be included in the SEC definition of wells
drilled.
|
|
|
|
|
|
|
|
|
|
|
|
|
|
|
|
|
|
|
|
|
|
Attachment 10
|
|
HEDGES - CURRENT
|
|
|
|
|
|
|
|
|
|
|
|
|
|
|
|
|
|
|
|
|
|
|
|
|
|
1Q
|
|
2Q
|
|
3Q
|
|
4Q
|
|
1Q
|
|
|
|
|
2019
|
|
|
2019
|
|
|
2019
|
|
|
2019
|
|
|
2020
|
|
CRUDE OIL
|
|
|
|
|
|
|
|
|
|
|
|
Sold Calls:
|
|
|
|
|
|
|
|
|
|
|
|
Barrels per day
|
|
|
15,000
|
|
|
5,000
|
|
|
—
|
|
|
—
|
|
|
—
|
|
Weighted-average Brent price per barrel
|
|
$
|
66.15
|
|
$
|
68.45
|
|
$
|
—
|
|
$
|
—
|
|
$
|
—
|
|
|
|
|
|
|
|
|
|
|
|
|
|
Purchased Calls:
|
|
|
|
|
|
|
|
|
|
|
|
Barrels per day
|
|
|
2,000
|
|
|
—
|
|
|
—
|
|
|
—
|
|
|
—
|
|
Weighted-average Brent price per barrel
|
|
$
|
71.00
|
|
$
|
—
|
|
$
|
—
|
|
$
|
—
|
|
$
|
—
|
|
|
|
|
|
|
|
|
|
|
|
|
|
Purchased Puts:
|
|
|
|
|
|
|
|
|
|
|
|
Barrels per day
|
|
|
38,000
|
|
|
40,000
|
|
|
40,000
|
|
|
35,000
|
|
|
10,000
|
|
Weighted-average Brent price per barrel
|
|
$
|
65.66
|
|
$
|
69.75
|
|
$
|
73.13
|
|
$
|
75.71
|
|
$
|
75.00
|
|
|
|
|
|
|
|
|
|
|
|
|
|
Sold Puts:
|
|
|
|
|
|
|
|
|
|
|
|
Barrels per day
|
|
|
40,000
|
|
|
35,000
|
|
|
40,000
|
|
|
35,000
|
|
|
10,000
|
|
Weighted-average Brent price per barrel
|
|
$
|
51.88
|
|
$
|
55.71
|
|
$
|
57.50
|
|
$
|
60.00
|
|
$
|
60.00
|
|
|
|
|
|
|
|
|
|
|
|
|
|
Swaps:
|
|
|
|
|
|
|
|
|
|
|
|
Barrels per day
|
|
|
7,000
|
|
|
—
|
|
|
—
|
|
|
—
|
|
|
—
|
|
Weighted-average Brent price per barrel
|
|
$
|
67.71
|
|
$
|
—
|
|
$
|
—
|
|
$
|
—
|
|
$
|
—
|
|
|
|
|
|
|
|
|
|
|
|
|
|
|
|
|
|
|
The BSP JV entered into crude oil derivatives that are included in
our consolidated results but not in the above table. The hedges
entered into by the BSP JV could affect the timing of the redemption
of the JV interest. The BSP JV sold calls for up to approximately
1,000 barrels per day at a weighted-average price per barrel of
$60.00 for 2019 through 2020. The BSP JV purchased puts for up to
approximately 2,000 barrels per day at a weighted-average price per
barrel of approximately $50.00 for 2019 through 2021. The BSP JV
also entered into natural gas swaps for insignificant volumes for
periods through May 2021.
|
|
|
|
In May 2018 we entered into derivative contracts that limit our
interest rate exposure with respect to $1.3 billion of our
variable-rate indebtedness. The interest rate contracts reset
monthly and require the counterparties to pay any excess interest
owed on such amount in the event the one-month LIBOR exceeds 2.75%
for any monthly period prior to May 4, 2021.
|
|
|
|
|
|
|
|
|
|
|
|
|
|
|
|
|
|
|
|
|
|
Attachment 11
|
|
RESERVES
|
|
|
|
|
|
|
|
|
|
|
|
|
|
San Joaquin
|
|
Los Angeles
|
|
Ventura
|
|
Sacramento
|
|
|
|
As of December 31, 2018
|
|
Basin
|
|
Basin
|
|
Basin
|
|
Basin
|
|
Total
|
|
Oil Reserves (MMBbl)
|
|
|
|
|
|
|
|
|
|
|
|
Proved Developed Reserves
|
|
231
|
|
131
|
|
27
|
|
—
|
|
389
|
|
Proved Undeveloped Reserves
|
|
86
|
|
42
|
|
13
|
|
—
|
|
141
|
|
Total
|
|
317
|
|
173
|
|
40
|
|
—
|
|
530
|
|
|
|
|
|
|
|
|
|
|
|
|
|
NGLs Reserves (MMBbl)
|
|
|
|
|
|
|
|
|
|
|
|
Proved Developed Reserves
|
|
45
|
|
—
|
|
2
|
|
—
|
|
47
|
|
Proved Undeveloped Reserves
|
|
12
|
|
—
|
|
1
|
|
—
|
|
13
|
|
Total
|
|
57
|
|
—
|
|
3
|
|
—
|
|
60
|
|
|
|
|
|
|
|
|
|
|
|
|
|
Natural Gas Reserves (Bcf)
|
|
|
|
|
|
|
|
|
|
|
|
Proved Developed Reserves
|
|
473
|
|
9
|
|
23
|
|
60
|
|
565
|
|
Proved Undeveloped Reserves
|
|
148
|
|
4
|
|
9
|
|
8
|
|
169
|
|
Total
|
|
621
|
|
13
|
|
32
|
|
68
|
|
734
|
|
|
|
|
|
|
|
|
|
|
|
|
|
Total Reserves (MMBoe)(a)
|
|
|
|
|
|
|
|
|
|
|
|
Proved Developed Reserves
|
|
355
|
|
132
|
|
33
|
|
10
|
|
530
|
|
Proved Undeveloped Reserves
|
|
123
|
|
43
|
|
15
|
|
1
|
|
182
|
|
Total
|
|
478
|
|
175
|
|
48
|
|
11
|
|
712
|
|
|
|
|
|
|
|
|
|
|
|
|
|
Note: MMBbl refers to millions of barrels; Bcf refers to billions of
cubic feet; MMBoe refers to millions of barrels of oil equivalent.
|
|
|
|
|
(a) Natural gas volumes have been converted to BOE based on the
equivalence of energy content between six Mcf of natural gas and one
Bbl of oil. Barrels of oil equivalence does not necessarily result
in price equivalence.
|
|
|
|
|
|
Attachment 12
|
|
2019 FIRST QUARTER GUIDANCE
|
|
|
|
|
|
|
|
|
|
|
|
Anticipated Realizations Against the Prevailing Index Prices for
Q1 2019 (a)
|
|
Oil
|
|
|
|
94% to 99% of Brent
|
|
NGLs
|
|
|
|
55% to 60% of Brent
|
|
Natural Gas
|
|
|
|
100% to 110% of NYMEX
|
|
|
|
|
|
|
|
2019 First Quarter Production, Capital and Income Statement
Guidance
|
|
Production (b) & (c)
|
|
|
|
132 to 137 MBOE per day
|
|
Capital (d)
|
|
|
|
$110 million to $140 million
|
|
Production costs (b) & (c)
|
|
|
|
$18.25 to $19.75 per BOE
|
|
Adjusted general and administrative expenses (b) & (e)
|
|
|
|
$6.55 to $6.95 per BOE
|
|
Depreciation, depletion and amortization (b)
|
|
|
|
$9.85 to $10.15 per BOE
|
|
Taxes other than on income
|
|
|
|
$41 million to $45 million
|
|
Exploration expense
|
|
|
|
$9 million to $14 million
|
|
Interest expense (f)
|
|
|
|
$98 million to $103 million
|
|
Cash interest (f)
|
|
|
|
$70 million to $75 million
|
|
Income tax expense rate
|
|
|
|
0%
|
|
Cash tax rate
|
|
|
|
0%
|
|
|
|
|
|
|
|
|
|
|
|
|
|
Pre-tax 2019 First Quarter Price Sensitivities (g)
|
|
|
|
|
|
$1 change in Brent index - Oil (h)
|
|
|
|
$4.6 million
|
|
$1 change in Brent index - NGLs
|
|
|
|
$0.9 million
|
|
$0.50 change in NYMEX - Gas
|
|
|
|
$4.7 million
|
|
|
|
(a) Realizations exclude hedge effects.
|
|
|
|
(b) Based on an average assumed Q1 2019 Brent price of $60 per
barrel.
|
|
|
|
(c) Based on an average assumed Brent price of $65 per barrel, Q1
2019 production would be 131 to 136 MBOE per day and production
costs would be $18.40 to $19.90 per BOE. Based on an average assumed
Brent price of $70 per barrel, Q1 2019 production would be 130 to
135 MBOE per day and production costs would be $18.50 to $20.00 per
BOE.
|
|
|
|
(d) Capital guidance includes CRC, BSP and MIRA capital.
|
|
|
|
(e) Our long-term incentive compensation programs for employees are
stock based but payable in cash. Accounting rules require that we
adjust the cumulative liability for all vested but unpaid awards
under these programs to the amount that would be paid using our
stock price as of the end of each reporting period. Therefore, in
addition to the normal pro-rata vesting expense associated with
these programs, our quarterly G&A expense could include this
cumulative adjustment depending on movement in our stock price. Our
stock price used to set first quarter 2019 guidance was $20.00 per
share. This results in an upward cumulative stock compensation
adjustment due to the higher stock price compared to year-end. Only
about 1/3 of such cumulative adjustment would result in a cash
liability in the same year as the adjustment because of the pro-rata
three-year vesting of our incentive compensation programs.
|
|
|
|
(f) Interest expense includes cash interest, original issue discount
and amortization of deferred financing costs as well as the deferred
gain that resulted from the December 2015 debt exchange. Cash
interest for the quarter is lower than interest expense due to the
timing of interest payments.
|
|
|
|
(g) Due to our tax position there is no difference between the
impact on our income and cash flows.
|
|
|
|
(h) Amount reflects the sensitivity with respect to unhedged barrels
which have no upside limitation. We have downside protection on
approximately 53% of our oil production, at a weighted average Brent
floor price of $66 per barrel below which we receive Brent plus
approximately $14 per barrel.
|

View source version on businesswire.com: https://www.businesswire.com/news/home/20190227005941/en/
