CoreLogic Reports Homeowners with Negative Equity Increased by 35,000 in the Fourth Quarter of 2018
Business Wire 7-Mar-2019 8:01 AM
-
The quarterly increase in negative equity was the first increase in
12 quarters
-
The number of owners with negative equity has decreased during the
last four quarters by 350,000, or 14 percent
-
The average homeowner gained $9,700 in home equity over the last
four quarters
CoreLogic® (NYSE:CLGX), a leading global property
information, analytics and data-enabled solutions provider, today
released the Home
Equity Report for the fourth quarter of 2018. The report shows that
U.S. homeowners with mortgages (which account for roughly 63 percent of
all properties) have seen their equity increase by 8.1 percent year over
year, representing a gain of nearly $678.4 billion since the fourth
quarter of 2017.
This press release features multimedia. View the full release here:
https://www.businesswire.com/news/home/20190307005147/en/
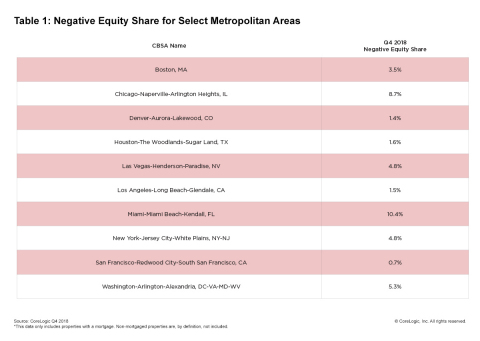
CoreLogic Q4 2018 Negative Equity Share for Select Metropolitan Areas. (Graphic: Business Wire)
Additionally, the average homeowner gained $9,700 in home equity between
the fourth quarter of 2017 and the fourth quarter of 2018. While home
equity grew in almost every state in the nation, western states
experienced the most significant annual increases. Nevada homeowners
gained an average of approximately $29,400 in home equity, while Hawaii
homeowners gained an average of approximately $26,900 and Idaho
homeowners gained an average of $24,700. California homeowners
experienced the fourth-highest growth with an average increase of
approximately $19,600 in home equity (Figure 1).
From the
third quarter of 2018 to the fourth quarter of 2018, the total
number of mortgaged homes in negative equity increased 1.6 percent to
2.2 million homes or 4.2 percent of all mortgaged properties. This was
the first quarterly increase since the fourth quarter of 2015. Despite
that quarter-over-quarter increase, on a year-over-year basis, the
number of mortgaged properties in negative equity fell 14 percent, or by
351,000, from 2.6 million homes – or 4.9 percent of all mortgaged
properties – in the fourth quarter of 2018.
"Our forecast for the CoreLogic Home Price Index predicts there will be
a 4.5 percent increase in our national index from December 2018 to the
end of 2019," said Dr. Frank Nothaft, chief economist for CoreLogic. "If
all homes experience this gain, this would lift about 350,000 homeowners
from being underwater and restore positive equity."
Negative equity, often referred to as being underwater or upside down,
applies to borrowers who owe more on their mortgages than their homes
are worth. Negative equity can occur because of a decline in a home's
value, an increase in mortgage debt or both. Negative equity peaked at
26 percent of mortgaged residential properties in the fourth quarter of
2009, based on the CoreLogic equity data analysis, which began in the
third quarter of 2009.
The national aggregate value of negative equity was approximately $300.3
billion at the end of the fourth quarter of 2018. This is up
approximately $17.4 billion from $282.9 billion in the third quarter of
2018 and up year over year by approximately $14.4 billion from $285.9
billion in the fourth quarter of 2017.
"As home prices rise, significantly more people are choosing to remodel,
repair or upgrade their existing homes. The increase in home equity over
the past several years provides homeowners with the means to finance
home remodels and repairs," said Frank Martell, president and CEO of
CoreLogic. "With rates still ultra-low by historical standards,
home-equity loans provide a low-cost method to finance home-improvement
spending. These expenditures are expected to rise 5 percent in 2019."
For ongoing housing trends and data, visit the CoreLogic Insights Blog: www.corelogic.com/insights-index.aspx.
Methodology
The amount of equity for each property is determined by comparing the
estimated current value of the property against the mortgage debt
outstanding (MDO). If the MDO is greater than the estimated value, then
the property is determined to be in a negative equity position. If the
estimated value is greater than the MDO, then the property is determined
to be in a positive equity position. The data is first generated at the
property level and aggregated to higher levels of geography. CoreLogic
data includes more than 50 million properties with a mortgage, which
accounts for more than 95 percent of all mortgages in the U.S. CoreLogic
uses public record data as the source of the MDO, which includes both
first-mortgage liens and second liens, and is adjusted for amortization
and home equity utilization in order to capture the true level of MDO
for each property. The calculations are not based on sampling, but
rather on the full data set to avoid potential adverse selection due to
sampling. The current value of the property is estimated using a suite
of proprietary CoreLogic valuation techniques, including valuation
models and the CoreLogic Home Price Index (HPI). In August 2016, the
CoreLogic HPI was enhanced to include nearly one million additional
repeat sales records from proprietary data sources that provide greater
coverage in home price changes nationwide. The increased coverage is
particularly useful in 14 non-disclosure states. Additionally, a new
modeling methodology has been added to the HPI to weight outlier pairs,
ensuring increased consistency and reducing month-over-month revisions.
The use of the enhanced CoreLogic HPI was implemented with the Q2 2016
Equity report. Only data for mortgaged residential properties that have
a current estimated value are included. There are several states or
jurisdictions where the public record, current value or mortgage data
coverage is thin and have been excluded from the analysis. These
instances account for fewer than 5 percent of the total U.S. population.
The percentage of homeowners with a mortgage is from the 2016 American
Community Survey. Fourth quarter of 2017 data was revised. Revisions
with public records data are standard, and to ensure accuracy, CoreLogic
incorporates the newly released public data to provide updated results.
Source: CoreLogic
The data provided is for use only by the primary recipient or the
primary recipient's publication or broadcast. This data may not be
re-sold, republished or licensed to any other source, including
publications and sources owned by the primary recipient's parent company
without prior written permission from CoreLogic. Any CoreLogic data used
for publication or broadcast, in whole or in part, must be sourced as
coming from CoreLogic, a data and analytics company. For use with
broadcast or web content, the citation must directly accompany first
reference of the data. If the data is illustrated with maps, charts,
graphs or other visual elements, the CoreLogic logo must be included on
screen or website. For questions, analysis or interpretation of the
data, contact Alyson Austin at newsmedia@corelogic.com
or Allyse Sanchez at corelogic@ink-co.com.
Data provided may not be modified without the prior written permission
of CoreLogic. Do not use the data in any unlawful manner. This data is
compiled from public records, contributory databases and proprietary
analytics, and its accuracy depends upon these sources.
About CoreLogic
CoreLogic (NYSE:CLGX) is a leading global property information,
analytics and data-enabled solutions provider. The company's combined
data from public, contributory and proprietary sources includes over 4.5
billion records spanning more than 50 years, providing detailed coverage
of property, mortgages and other encumbrances, consumer credit, tenancy,
location, hazard risk and related performance information. The markets
CoreLogic serves include real estate and mortgage finance, insurance,
capital markets, and the public sector. CoreLogic delivers value to
clients through unique data, analytics, workflow technology, advisory
and managed services. Clients rely on CoreLogic to help identify and
manage growth opportunities, improve performance and mitigate risk.
Headquartered in Irvine, Calif., CoreLogic operates in North America,
Western Europe and Asia Pacific. For more information, please visit www.corelogic.com.
CORELOGIC and the CoreLogic logo are trademarks of CoreLogic, Inc.
and/or its subsidiaries. All other trademarks are the property of their
respective owners.

View source version on businesswire.com: https://www.businesswire.com/news/home/20190307005147/en/
