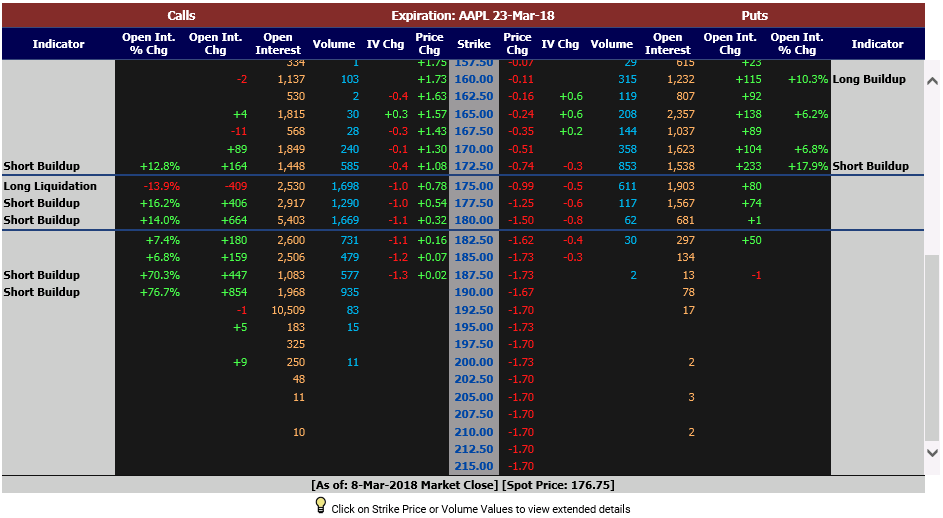
View detailed open interest values for EWZ listed options, including Technical Analysis on whether the changes represent a long or short trend for the option. Also, you can view the changes in open interest for each option over the last 5 days by selecting the 5-Day Trends by Option tab, or view the historical daily open interest for up to the last year on the Historical tab.
▲ Close
| Call Open Interest | ||
|---|---|---|
| 88% | 52-Week Pct Rank | |
| Put Open Interest | ||
|---|---|---|
| 56% | 52-Week Pct Rank | |
| Total Open Interest | ||
|---|---|---|
| 4,300,565 | 1-Day Change | |
| 5-Day Change | ||
| 52-Week Avg. | ||
| Call Open Interest | ||
|---|---|---|
| 2,905,536 | 1-Day Change | |
| 5-Day Change | ||
| 52-Week Avg. | ||
| Put Open Interest | ||
|---|---|---|
| 1,395,029 | 1-Day Change | |
| 5-Day Change | ||
| 52-Week Avg. | ||
| Put / Call Open Int. Ratio | ||
|---|---|---|
| 0.5 | 1-Day Change | 5-Day Change |
| 52-Week Avg. | ||
Long Liquidation happens when there is a decrease in open interest along with a decrease in implied volatility, indicating that traders are trying to sell out of their long positions in the option.
Long Buildup is an increase in open interest along with an increase in implied volatility, indicating that traders are adding to long positions in the option.
Short Buildup is an increase in open interest but a decrease in implied volatility, suggesting that traders are selling more contracts on short positions in the option.
Short Covering is a decrease in open interest but an increase in implied volatility, suggesting that traders are buying back to cover short positions in the option.
