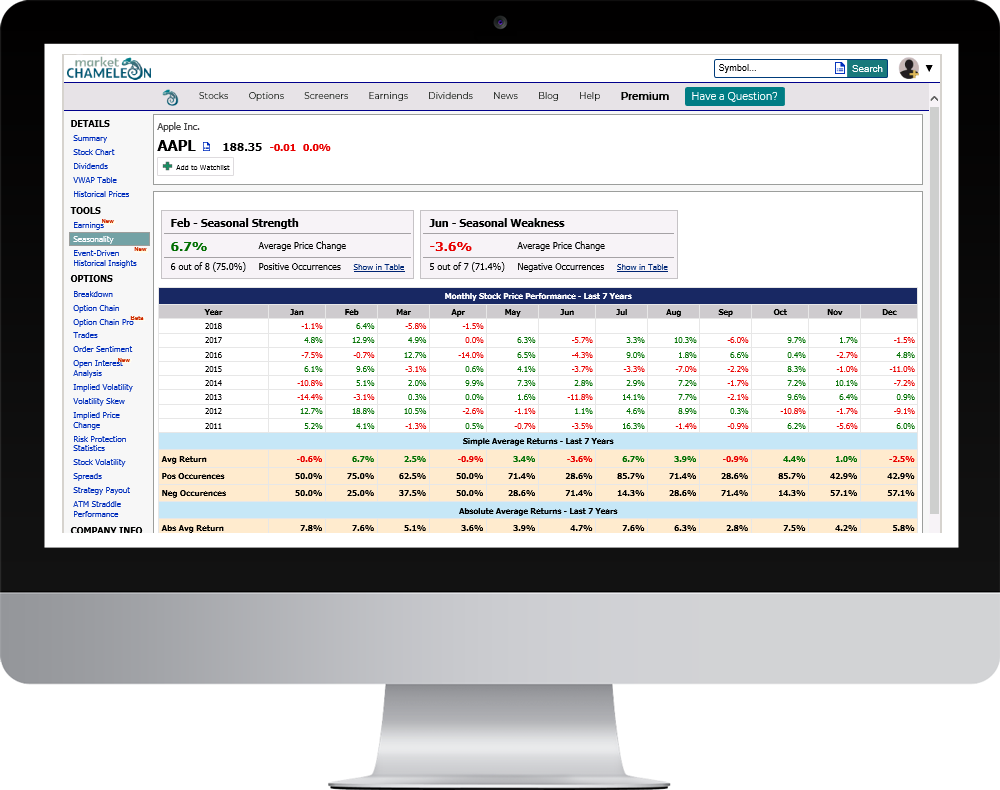
Month-by-month performance of Franklin U.S. Equity Bitcoin Drip Index ETF (FBEQ) stock: average returns, win rates and the best and worst months to hold it.
For the latest figures, see FBEQ stock summary.
Determine Best and Worst seasonal strength months and average Price Changes for each month over the past 7 years. Quickly detect historical price patterns, percentage win rates, and median, minimum and maximum statistics by month. Click here to learn more about Monthly Seasonality.
▲ Close