Site Features

Symbol Links

Option Chain

Advanced Stock Chart

Historical Price Return Distribution Report

Forward-Looking Earnings Dates Report

Recent Dividend Announcements and Guidance Report

Future Ex-Dividend Dates Report

Option Repeat Trade Screener

Option Order Flow Sentiment Screener

Week-by-Week ATM Straddle Performance Report

Symbol ATM Straddle Performance

Seasonality Screener By Calendar Month

Seasonality Monitor By Calendar Month

Earnings Stock Pattern Screener

Earnings Option Strategy Screener

Event-Driven Historical Insights

At-the-Money Option Straddle Screener

Large Dollar Volume Burst Trades

Option Contract Analytics

Option Contract Historical Data Analytics

Option Contract Implied Volatility Chart

Option Contract Time And Sales

Option Contract Single-Leg Trades

Option Contract Multi-Leg Trades

Unusual Options Activty

How to use the earnings calendar

How do I cancel my subscription?

Glossary

Glossary

Financial Concepts

Stocks vs. Options

Dividends

Earnings

ETFs and ETNs

Bid-Ask Spread

Theoretical Edge

Relative Strength Performance

Stock Seasonality

Payout Diagrams

Option Delta Volume

Options Basics

Introduction

Brokerage Account

Option Chain

Open Interest

Delta

Gamma

Theta

Vega

Rho

Volatility

Skew

Cost of Carry

Option FAQs

Options Trading

Option Strategies Overview

Put Protection

Buy-Write

Synthetic Stock Positions

Delta Neutral Trading

Multi-Leg Option Trade Analyzer

Multi-Leg Option Trades Screener

Misc.

Stock Order Imbalance

Threshold List

How To

How to Trade Around Earnings

How to Find a Bull Call Spread for a Specific Stock

How to Use an Options Profit Calculator

How to Find a Stocks Historical Price Moves Around Earnings

How to Subscribe to Market Chameleon from Interactive Brokers

Seasonality Monitor By Calendar Month

How to find it?

Go to any product (for example, search for AAPL) > Under the Tools section click Seasonality (or Click Here for the AAPL Seasonality Monitor)

How to use it?

You can use this report to spot Seasonal stock patterns that display Strength and Weakness by calendar month. The report also calculates absolute returns and max min movements to gauge which periods tended to have more or less volatile recurrences . Compare holding periods with % Win Rates, Average Returns, Median Returns.

The screenshot below is an example of the insights you would see from the Seasonality Monitor By Calendar Month.

Example of results of the seasonality monitor by calendar month.

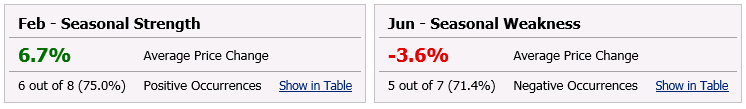
The system will automatically display the calendar month with the highest seasonal strength and weakness (with an occurrence rate above 50%), based on the number of positive and negative returns that occurred historicallly over the years of available data.


The screenshot below shows the detailed results of the seasonality monitor.

Example of filters of the seasonality monitor by calendar month.

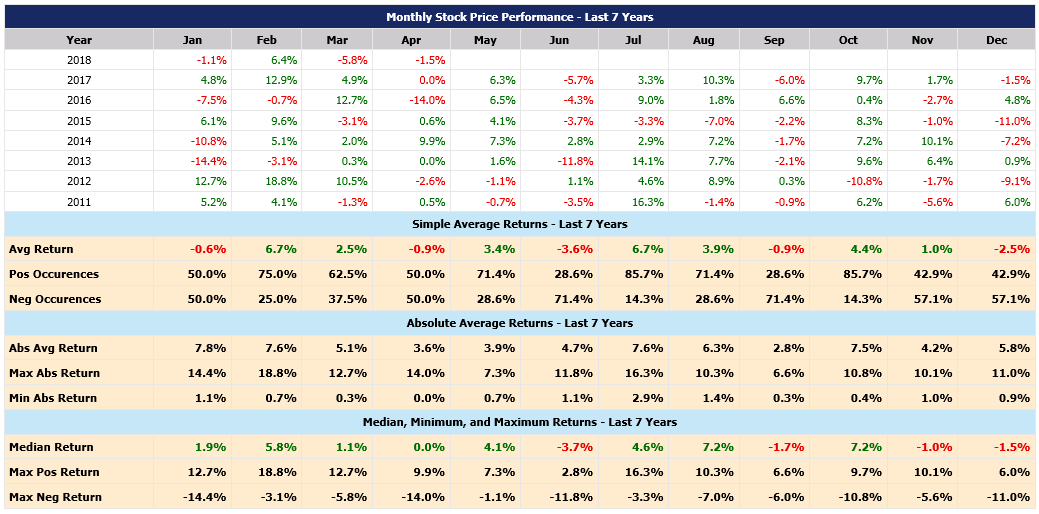
The table organizes calendar returns by year and month to spot trends and patterns. At the bottom of the data table, results are summarized for the calendar months by Average returns, % positive and % negative returns for frequency. Absolute (Abs) Avg, Abs Max, and Abs Min Returns (these values are converted to positive before calculations, i.e. Absolute Value) to gauge the magnitude of the moves in order to spot higher and lower volatility periods. The Median, Minimum and Maximum Returns section displays the median return to be used as a comparison to the average return because the average return can be skewed due to outliers. Max and Min show the best and worst returns for the calendar period.

Market Data Delayed 15 Minutes