


Monthly implied volatility for Latam Airlines Group S.A. American Depositary Shares (Each Representing Two Thousand (2000) Shares Of Common Stock) (LTM) compared with its realized (OHLC) volatility.
For the latest figures, see LTM implied volatility.
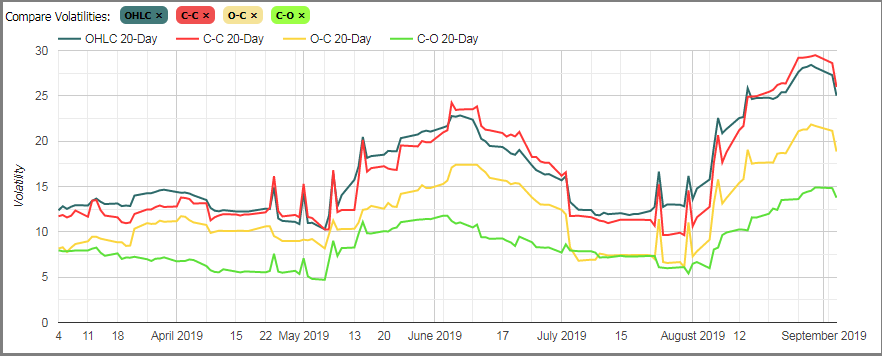
20-Day Rolling Volatility for Open-High-Low-Close (OHLC), Close-to-Close (CC), Open-to-Close (OC), and Close-to-Open (CO)
| Realized Stock Volatility | ||
|---|---|---|
| Duration | Volatility | Median |
| Today | -- | |
| 10-Day | ||
| 20-Day | ||
| 60-Day | ||
| 1-Year | ||
| Implied Volatility | |||
|---|---|---|---|
| Duration | Average | Low | High |
| Today | |||
| 10 Day | |||
| 20 Day | |||
| 60 Day | |||
| 1 Year | |||


