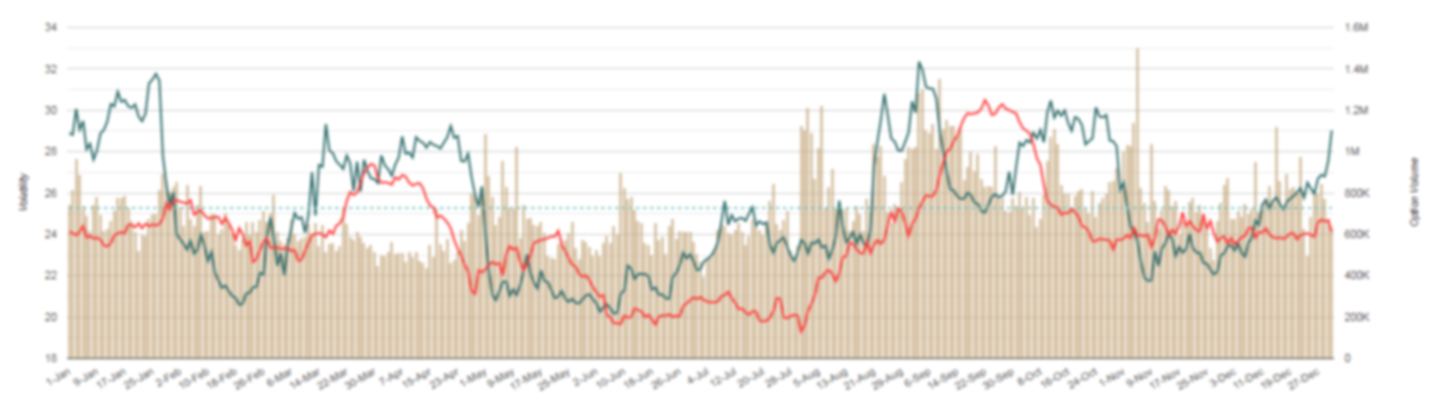
Seasonal patterns for Universal Display (OLED): implied volatility, historical volatility and option volume averaged for each day of the year, going back to 2014.
For the latest figures, see OLED implied volatility.
The following chart shows how implied volatility (IV30) trended by calendar period to detect seasonal patterns during the year.