Exelon Reports Fourth Quarter and Full Year 2018 Results and Initiates 2019 Financial Outlook
Business Wire 8-Feb-2019 6:47 AM
-
Exelon's GAAP Net Income for the fourth quarter of 2018 decreased to
$0.16 per share from $1.94 per share in the fourth quarter of 2017.
Adjusted (non-GAAP) Operating Earnings increased to $0.58 per share in
the fourth quarter of 2018 from $0.56 per share in the fourth quarter
of 2017
-
Exelon introduces a 2019 adjusted (non-GAAP) operating earnings
guidance range of $3.00-$3.30 per share, reflecting growth in
Utilities, recognition of New Jersey Zero Emissions Credit (ZEC)
revenues, and the impact of previously announced cost reduction
initiatives
-
Exelon Utilities project capital expenditures of $23 billion over the
next four years, supporting 7.8 percent annual rate base growth to the
benefit of its customers
-
Exelon Generation projects available cash flow of $7.8 billion over
the next four years, supporting Exelon's priorities of Utility
reinvestment and debt reduction
-
All four utilities ended the year in the top quartile for SAIFI
(outage frequency) while most utilities demonstrated strong
performance in CAIDI (outage duration) and customer satisfaction
-
Exelon Nuclear achieved the most nuclear power ever generated at 159
TWhs
Exelon Corporation (NYSE:EXC) today reported its financial results for
the fourth quarter and full year 2018.
This press release features multimedia. View the full release here:
https://www.businesswire.com/news/home/20190208005190/en/
Exelon fourth quarter and full year 2018 highlights (Graphic: Business Wire)
"This was another record-breaking year for Exelon, with our Utility and
Generation businesses demonstrating best-ever performances in multiple
categories thanks to the hard work of our employees, who also surpassed
their previous record for volunteerism. Our ongoing strategy to invest
in advanced technology and infrastructure resulted in improved
resiliency, reliability and customer satisfaction at our electric and
gas companies," said Chris Crane, Exelon president and CEO. "In 2019, we
will grow our dividend by 5 percent and seek fair compensation for the
zero-carbon power our nuclear fleet provides. We will also modernize the
electric grid to address the challenges of climate change and to provide
customers with clean, affordable power."
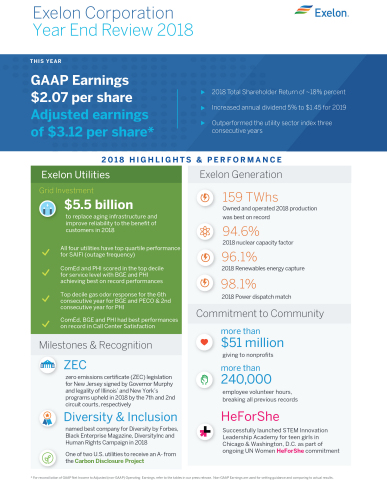
"Exelon delivered another solid financial performance in 2018, earning
$3.12 per share on an adjusted (non-GAAP) operating basis, which is at
the midpoint of our revised full year guidance of $3.05-$3.20 per share
and $0.07 above our original midpoint," said Joe Nigro, Exelon senior
executive vice president and CFO. "Over the next four years we will
invest nearly $23 billion to strengthen the reliability and resiliency
of our system, enable our communities to meet their low carbon energy
goals and improve service to our 10 million utility customers. The
successes we achieved in 2018 position us well for the year ahead, and
we anticipate even more benefits from much-needed policy and market
reforms."
Fourth Quarter 2018
Exelon's GAAP Net Income for the fourth quarter of 2018 decreased to
$0.16 per share from $1.94 per share in the fourth quarter of 2017.
Adjusted (non-GAAP) Operating Earnings increased to $0.58 per share in
the fourth quarter of 2018 from $0.56 per share in the fourth quarter of
2017. For the reconciliations of GAAP Net Income to Adjusted (non-GAAP)
Operating Earnings, refer to the tables beginning on page 7.
Adjusted (non-GAAP) Operating Earnings in the fourth quarter of 2018
primarily reflect higher utility earnings due to electric distribution
and energy efficiency earnings at ComEd, regulatory rate increases at
PHI and the absence of a 2017 impairment of certain transmission-related
income tax regulatory assets; and, at Generation, lower realized energy
prices, partially offset by the favorable impacts of Illinois ZEC
revenue, increased capacity prices and tax savings related to the Tax
Cuts and Jobs Act (TCJA).
Full Year 2018
Exelon's GAAP Net Income decreased to $2.07 per share from $3.99 per
share in 2017. Exelon's Adjusted (non-GAAP) Operating Earnings for 2018
increased to $3.12 per share from $2.62 per share in 2017.
Adjusted (non-GAAP) Operating Earnings for the full year 2018 reflect
higher utility earnings due to electric distribution and energy
efficiency earnings at ComEd, regulatory rate increases at BGE and PHI,
favorable weather conditions and volumes at PECO and PHI and the absence
of a 2017 impairment of certain transmission-related income tax
regulatory assets, all of which were partially offset by increased storm
costs at PECO and BGE. On the Generation side, the Adjusted (non-GAAP)
Operating Earnings also reflect the favorable impacts of New York and
Illinois ZEC revenue (including the impact of ZECs generated in Illinois
from June 1, 2017 through Dec. 31, 2017), increased capacity prices, tax
savings related to the TCJA, realized gains on nuclear decommissioning
trust (NDT) funds and decreased nuclear outage days, all of which were
partially offset by lower realized energy prices and the absence of
earnings from Exelon Generation Texas Power due to its deconsolidation
in the fourth quarter of 2017.
Operating Company Results1
ComEd
ComEd's fourth quarter of 2018 GAAP Net Income increased to $141 million
from $120 million in the fourth quarter of 2017. ComEd's Adjusted
(non-GAAP) Operating Earnings for the fourth quarter of 2018 increased
to $141 million from $123 million in the fourth quarter of 2017,
primarily reflecting higher electric distribution and energy efficiency
earnings. Due to revenue decoupling, ComEd's distribution earnings are
not affected by actual weather or customer usage patterns.
____________________
1Exelon's five business units include ComEd, which consists
of electricity transmission and distribution operations in northern
Illinois; PECO, which consists of electricity transmission and
distribution operations and retail natural gas distribution operations
in southeastern Pennsylvania; BGE, which consists of electricity
transmission and distribution operations and retail natural gas
distribution operations in central Maryland; PHI, which consists of
electricity transmission and distribution operations in the District of
Columbia and portions of Maryland, Delaware, and New Jersey and retail
natural gas distribution operations in northern Delaware; and
Generation, which consists of owned and contracted electric generating
facilities and wholesale and retail customer supply of electric and
natural gas products and services, including renewable energy products
and risk management services.
PECO
PECO's fourth quarter of 2018 GAAP Net Income increased to $124 million
from $107 million in the fourth quarter of 2017. PECO's Adjusted
(non-GAAP) Operating Earnings for the fourth quarter of 2018 increased
to $125 million from $95 million in the fourth quarter of 2017,
primarily due to favorable volumes and income tax impacts.
BGE
BGE's fourth quarter of 2018 GAAP Net Income decreased to $71 million
from $76 million in the fourth quarter of 2017. BGE's Adjusted
(non-GAAP) Operating Earnings for the fourth quarter of 2018 decreased
to $72 million from $82 million in the fourth quarter of 2017. Due to
revenue decoupling, BGE's distribution earnings are not affected by
actual weather or customer usage patterns.
PHI
PHI's fourth quarter of 2018 GAAP Net Income increased to $62 million
from $4 million in the fourth quarter of 2017. PHI's Adjusted (non-GAAP)
Operating Earnings for the fourth quarter of 2018 increased to $68
million from $48 million in the fourth quarter of 2017, primarily due to
regulatory rate increases and the absence of a 2017 impairment of
certain transmission-related income tax regulatory assets. Due to
revenue decoupling, PHI's distribution earnings related to Pepco
Maryland, DPL Maryland and Pepco District of Columbia are not affected
by actual weather or customer usage patterns.
Generation
Generation had a GAAP Net Loss of $178 million in the fourth quarter of
2018 compared with GAAP Net Income of $2,224 million in the fourth
quarter of 2017. Generation's Adjusted (non-GAAP) Operating Earnings for
the fourth quarter of 2018 decreased to $221 million from $261 million
in the fourth quarter of 2017, primarily reflecting lower realized
energy prices, partially offset by the favorable impacts of Illinois ZEC
revenue, increased capacity prices and tax savings related to the TCJA.
The proportion of expected generation hedged for the Mid-Atlantic,
Midwest, New York and ERCOT reportable segments as of Dec. 31, 2018, was
89.0 percent to 92.0 percent for 2019, 56.0 percent to 59.0 percent for
2020 and 32.0 percent to 35.0 percent for 2021.
Initiates Annual Guidance for 2019
Exelon introduced a guidance range for 2019 Adjusted (non-GAAP)
Operating Earnings of $3.00 to $3.30 per share. The outlook for 2019
Adjusted (non-GAAP) Operating Earnings for Exelon and its subsidiaries
excludes the following items:
-
Mark-to-market adjustments from economic hedging activities;
-
Unrealized gains and losses from NDT funds to the extent not offset by
contractual accounting as described in the notes to the consolidated
financial statements;
-
Certain costs incurred related to plant retirements;
-
Certain costs incurred to achieve cost management program savings;
-
Other unusual items; and
-
Generation's noncontrolling interest related to Constellation Energy
Nuclear Group (CENG) exclusion items.
Recent Developments and Fourth Quarter Highlights
-
Utility Capex and Rate Base Update: Exelon Utilities will
invest nearly $23 billion of capital over the next four years. These
investments will help ensure more reliable and efficient transmission
and distribution of electricity and gas for our 10 million utility
customers, while also preparing us for the future. The increased
capital investments are expected to drive rate base growth 7.8 percent
annually to $50.7 billion by 2022 and exceed the 7.4 percent growth
expectations for 2017-2021 projected a year ago.
-
Generation and Free Cash Flow Outlook: Cumulatively from 2019
through 2022, Generation projects $7.8 billion of available cash flow
before growth capex, which is $0.2 billion higher than the prior
4-year outlook. This financial outlook accounts for the latest power
price forwards at year-end, current gross margin outlook at
Constellation, latest O&M forecast that reflects pension cost updates
and the Everett Marine Terminal acquisition, benefits of previously
announced cost reduction initiatives and the planned closure of TMI.
The $7.8 billion will primarily support our strategic capital
allocation priorities which entail: i) funding $4.0-$4.4 billion of
growth capital at the utilities; ii) supporting our 5 percent annual
dividend growth commitment; and iii) reducing debt by $2.5 billion.
-
ComEd Distribution Rate Formula: On Dec. 4, 2018, the Illinois
Commerce Commission (ICC) issued its final order approving ComEd's
2018 annual distribution formula rate update. The final order resulted
in a $24 million decrease to the revenue requirement, reflecting a $58
million decrease for the initial revenue requirement for 2018 and a
$34 million increase related to the annual reconciliation for 2017.
The increase was set using an allowed return on rate base of
6.52 percent for the initial revenue requirement and the annual
reconciliation, inclusive of an allowed ROE of 8.69 percent. The rates
took effect in January 2019.
-
PECO Electric Distribution Base Rate Case: On Dec. 20, 2018,
the Pennsylvania Public Utility Commission (PAPUC) approved the
partial settlement agreement with an effective date of Jan. 1, 2019,
that provides for a $25 million net increase to PECO's annual electric
distribution base rates, which includes $71 million in annual ongoing
TCJA tax savings. In PECO's original filing with the PAPUC on March
29, 2018, PECO had requested a ROE of 10.95 percent. No approved ROE
was specified in the PAPUC order.
-
BGE Maryland Natural Gas Distribution Base Rate Case: On Jan.
4, 2019, the Maryland Public Service Commission (MDPSC) issued its
final order providing for a net increase to BGE's annual natural gas
distribution base rates of $43 million and reflecting a ROE of 9.8
percent.
-
Pepco Maryland Electric Distribution Base Rate Case: On Jan.
15, 2019, Pepco filed an application with the MDPSC, requesting a $30
million increase to its electric distribution base rates and a 10.3
percent ROE. Pepco currently expects a decision in the third quarter
of 2019 but cannot predict if the MDPSC will approve the application
as filed.
-
DPL Delaware Natural Gas Distribution Base Rate Case: On Nov.
8, 2018, the Delaware Public Service Commission (DPSC) approved the
settlement agreement, providing for a $4 million net decrease to DPL's
annual natural gas distribution base rates, which includes annual
ongoing TCJA tax savings and reflects a 9.7 percent ROE. In addition,
the settlement agreement separately provides a one-time bill credit to
customers of approximately $1 million representing the TCJA tax
savings for the period Feb. 1, 2018, through March 17, 2018, when full
interim rates were put into effect.
-
Mystic Cost-of-Service Federal Energy Regulatory Commission (FERC)
Filing: On Dec. 20, 2018, FERC issued an order accepting
Generation's cost of service agreement reflecting a number of
adjustments to the annual fixed revenue requirement and allowing for
recovery of a substantial portion of the costs associated with the
Everett Marine Terminal. FERC also directed a paper hearing on ROE
using a new methodology. Initial and reply briefs on ROE will be due
on April 18, 2019, and July 18, 2019, respectively. These will be
reflected in a compliance filing due Feb. 18, 2019. On Jan. 4, 2019,
Generation notified ISO-NE that it will participate in the Forward
Capacity Market auction for the 2022-2023 capacity commitment period.
In addition, on Jan. 22, 2019, Exelon and several other parties filed
requests for rehearing of certain findings of the Dec. 20, 2018,
order. The request for rehearing does not alter Generation's
commitment to participate in the Forward Capacity Auction for the
2022-2023 capacity commitment period.To ensure the
continued reliable supply of fuel to Mystic Units 8 and 9 while they
remain operating, on Oct. 1, 2018, Generation acquired the Everett
Marine Terminal in Massachusetts for a purchase price of $81 million.
Generation also settled its existing long-term gas supply agreement,
resulting in a $75 million pre-tax gain.
-
District of Columbia Clean Energy Act: On Dec. 18, 2018, the
Council of the District of Columbia passed the Clean Energy District
of Columbia Omnibus Amendment Act of 2018 (the Act), which was
subsequently signed by the Mayor of the District of Columbia on Jan.
18, 2019. The Act is expected to take effect in February 2019
following the expiration of a 30-day review process by the U.S. House
of Representatives. Among other things, the Act would increase
electric load by requiring all public buses, taxis and other specified
fleets to be solely zero-emissions vehicles by 2045. The Act would
also clarify that, under certain circumstances, the gas and electric
utilities may offer and receive cost recovery, including a return on
investment on capital and related costs for energy efficiency programs
in the District of Columbia.
-
Pension Plan Merger: Effective Jan. 1, 2019, Exelon is merging
the Exelon Corporation Cash Balance Pension Plan (CBPP) into the
Exelon Corporation Retirement Program (ECRP). The merging of the plans
is not changing the benefits offered to the plan participants and,
thus, has no impact on Exelon's pension obligation. However, beginning
in 2019, actuarial losses and gains related to the CBPP and ECRP will
be amortized over participants' average remaining service period of
the merged ECRP rather than each individual plan, which will lower
Exelon's 2019 pre-tax pension cost by approximately $90 million.
-
Nuclear Operations: Generation's nuclear fleet, including its
owned output from the Salem Generating Station and 100 percent of the
CENG units, produced 45,809 gigawatt-hours (GWhs) in the fourth
quarter of 2018, compared with 47,528 GWhs in the fourth quarter of
2017. Excluding Salem, the Exelon-operated nuclear plants at ownership
achieved a 95.1 percent capacity factor for the fourth quarter of
2018, compared with 95.3 percent for the fourth quarter of 2017.
Excluding Salem, the number of planned refueling outage days in the
fourth quarter of 2018 totaled 76, compared with 60 in the fourth
quarter of 2017. There were 18 non-refueling outage days in both the
fourth quarter of 2018 and 2017.
-
Fossil and Renewables Operations: The Dispatch Match rate for
Generation's gas and hydro fleet was 99.3 percent in the fourth
quarter of 2018, compared with 98.4 percent in the fourth quarter of
2017.Energy Capture for the wind and solar fleet was 97.0
percent in the fourth quarter of 2018, compared with 96.2 percent in
the fourth quarter of 2017.
-
Financing Activities: On Nov. 11, 2018, Pepco issued $100
million aggregate principal amount of its First Mortgage Bonds, 4.31
percent due Nov. 1, 2048. Pepco used the proceeds to repay outstanding
commercial paper and for general corporate purposes.
GAAP/Adjusted (non-GAAP) Operating Earnings Reconciliations
Adjusted (non-GAAP) Operating Earnings for the fourth quarter of 2018 do
not include the following items (after tax) that were included in
reported GAAP Net Income:
|
(in millions)
|
|
ExelonEarnings per Diluted Share
|
|
Exelon
|
|
ComEd
|
|
PECO
|
|
BGE
|
|
PHI
|
|
Generation
|
|
2018 GAAP Net Income (Loss)
|
|
$
|
0.16
|
|
|
$
|
152
|
|
|
$
|
141
|
|
|
$
|
124
|
|
|
$
|
71
|
|
|
$
|
62
|
|
|
$
|
(178
|
)
|
|
Mark-to-Market Impact of Economic Hedging Activities (net of taxes
of $63 and $61, respectively)
|
|
0.19
|
|
|
178
|
|
|
—
|
|
|
—
|
|
|
—
|
|
|
—
|
|
|
176
|
|
|
Unrealized Losses Related to Nuclear Decommissioning Trust (NDT)
Funds (net of taxes of $172)
|
|
0.25
|
|
|
243
|
|
|
—
|
|
|
—
|
|
|
—
|
|
|
—
|
|
|
243
|
|
|
Merger Commitments (net of taxes of $0 and $1, respectively)
|
|
—
|
|
|
—
|
|
|
—
|
|
|
—
|
|
|
—
|
|
|
4
|
|
|
—
|
|
|
Plant Retirements and Divestitures (net of taxes of $32 and $31,
respectively)
|
|
0.10
|
|
|
90
|
|
|
—
|
|
|
—
|
|
|
—
|
|
|
—
|
|
|
91
|
|
|
Cost Management Program (net of taxes of $6, $0, $0, $1 and $5,
respectively)
|
|
0.02
|
|
|
18
|
|
|
—
|
|
|
1
|
|
|
1
|
|
|
2
|
|
|
14
|
|
|
Annual Asset Retirement Obligation Update (net of taxes of $1)
|
|
—
|
|
|
4
|
|
|
—
|
|
|
—
|
|
|
—
|
|
|
—
|
|
|
4
|
|
|
Change in Environmental Liabilities (net of taxes of $1)
|
|
—
|
|
|
3
|
|
|
—
|
|
|
—
|
|
|
—
|
|
|
—
|
|
|
3
|
|
|
Gain on Contract Settlement (net of taxes of $20 and $19,
respectively)
|
|
(0.06
|
)
|
|
(55
|
)
|
|
—
|
|
|
—
|
|
|
—
|
|
|
—
|
|
|
(56
|
)
|
|
Reassessment of Deferred Income Taxes (entire amount represents tax
expense)
|
|
—
|
|
|
3
|
|
|
—
|
|
|
—
|
|
|
—
|
|
|
—
|
|
|
1
|
|
|
Noncontrolling Interests (net of taxes of $15)
|
|
(0.08
|
)
|
|
(77
|
)
|
|
—
|
|
|
—
|
|
|
—
|
|
|
—
|
|
|
(77
|
)
|
|
2018 Adjusted (non-GAAP) Operating Earnings
|
|
$
|
0.58
|
|
|
$
|
559
|
|
|
$
|
141
|
|
|
$
|
125
|
|
|
$
|
72
|
|
|
$
|
68
|
|
|
$
|
221
|
|
|
|
|
|
|
|
|
|
|
|
|
|
|
|
|
|
|
|
|
|
|
|
|
|
|
|
|
|
|
|
Adjusted (non-GAAP) Operating Earnings for the fourth quarter of 2017 do
not include the following items (after tax) that were included in
reported GAAP Net Income:
|
(in millions)
|
|
ExelonEarnings per Diluted Share
|
|
Exelon
|
|
ComEd
|
|
PECO
|
|
BGE
|
|
PHI
|
|
Generation
|
|
2017 GAAP Net Income
|
|
$
|
1.94
|
|
|
$
|
1,880
|
|
|
$
|
120
|
|
|
$
|
107
|
|
|
$
|
76
|
|
|
$
|
4
|
|
|
$
|
2,224
|
|
|
Mark-to-Market Impact of Economic Hedging Activities (net of taxes
of $7 and $6, respectively)
|
|
0.01
|
|
|
8
|
|
|
—
|
|
|
—
|
|
|
—
|
|
|
—
|
|
|
9
|
|
|
Unrealized Gains Related to NDT Funds (net of taxes of $105)
|
|
(0.11
|
)
|
|
(108
|
)
|
|
—
|
|
|
—
|
|
|
—
|
|
|
—
|
|
|
(108
|
)
|
|
Amortization of Commodity Contract Intangibles (net of taxes of $5)
|
|
0.01
|
|
|
8
|
|
|
—
|
|
|
—
|
|
|
—
|
|
|
—
|
|
|
8
|
|
|
Merger and Integration Costs (net of taxes of $1, $1 and $0,
respectively)
|
|
—
|
|
|
1
|
|
|
—
|
|
|
—
|
|
|
1
|
|
|
—
|
|
|
1
|
|
|
Long-Lived Asset Impairments (net of taxes of $16, $9 and $8,
respectively)
|
|
0.03
|
|
|
29
|
|
|
—
|
|
|
—
|
|
|
—
|
|
|
16
|
|
|
12
|
|
|
Plant Retirements and Divestitures (net of taxes of $45)
|
|
0.07
|
|
|
70
|
|
|
—
|
|
|
—
|
|
|
—
|
|
|
—
|
|
|
70
|
|
|
Cost Management Program (net of taxes of $6, $1, $0 and $5,
respectively)
|
|
0.01
|
|
|
10
|
|
|
—
|
|
|
1
|
|
|
1
|
|
|
—
|
|
|
8
|
|
|
Vacation Policy Change (net of taxes of $21, $1, $1, $3 and $16,
respectively)
|
|
(0.03
|
)
|
|
(33
|
)
|
|
—
|
|
|
(1
|
)
|
|
(1
|
)
|
|
(5
|
)
|
|
(26
|
)
|
|
Change in Environmental Liabilities (net of taxes of $17)
|
|
0.03
|
|
|
27
|
|
|
—
|
|
|
—
|
|
|
—
|
|
|
—
|
|
|
27
|
|
|
Gain on Deconsolidation of Businesses (net of taxes of $83)
|
|
(0.14
|
)
|
|
(130
|
)
|
|
—
|
|
|
—
|
|
|
—
|
|
|
—
|
|
|
(130
|
)
|
|
Reassessment of Deferred Income Taxes (entire amount represents tax
expense)
|
|
(1.30
|
)
|
|
(1,257
|
)
|
|
3
|
|
|
(12
|
)
|
|
5
|
|
|
33
|
|
|
(1,874
|
)
|
|
Noncontrolling Interests (net of taxes of $8)
|
|
0.04
|
|
|
40
|
|
|
—
|
|
|
—
|
|
|
—
|
|
|
—
|
|
|
40
|
|
|
2017 Adjusted (non-GAAP) Operating Earnings
|
|
$
|
0.56
|
|
|
$
|
545
|
|
|
$
|
123
|
|
|
$
|
95
|
|
|
$
|
82
|
|
|
$
|
48
|
|
|
$
|
261
|
|
|
|
|
|
|
|
|
|
|
|
|
|
|
|
|
|
|
|
|
|
|
|
|
|
|
|
|
|
|
|
Adjusted (non-GAAP) Operating Earnings for the full year 2018 do not
include the following items (after tax) that were included in reported
GAAP Net Income:
|
(in millions)
|
|
ExelonEarnings per Diluted Share
|
|
Exelon
|
|
ComEd
|
|
PECO
|
|
BGE
|
|
PHI
|
|
Generation
|
|
2018 GAAP Net Income
|
|
$
|
2.07
|
|
|
$
|
2,010
|
|
|
$
|
664
|
|
|
$
|
460
|
|
|
$
|
313
|
|
|
$
|
398
|
|
|
$
|
370
|
|
|
Mark-to-Market Impact of Economic Hedging Activities (net of taxes
of $89 and $84, respectively)
|
|
0.26
|
|
|
252
|
|
|
—
|
|
|
—
|
|
|
—
|
|
|
—
|
|
|
241
|
|
|
Unrealized Losses Related to NDT Funds (net of taxes of $289)
|
|
0.35
|
|
|
337
|
|
|
—
|
|
|
—
|
|
|
—
|
|
|
—
|
|
|
337
|
|
|
Merger and Integration Costs (net of taxes of $2)
|
|
—
|
|
|
3
|
|
|
—
|
|
|
—
|
|
|
—
|
|
|
—
|
|
|
3
|
|
|
Merger Commitments (net of taxes of $0 and $1, respectively)
|
|
—
|
|
|
—
|
|
|
—
|
|
|
—
|
|
|
—
|
|
|
4
|
|
|
—
|
|
|
Long-Lived Asset Impairments (net of taxes of $13)
|
|
0.04
|
|
|
35
|
|
|
—
|
|
|
—
|
|
|
—
|
|
|
—
|
|
|
35
|
|
|
Plant Retirements and Divestitures (net of taxes of $181 and $178,
respectively)
|
|
0.53
|
|
|
512
|
|
|
—
|
|
|
—
|
|
|
—
|
|
|
—
|
|
|
514
|
|
|
Cost Management Program (net of taxes of $16, $1, $1, $2 and $12
respectively)
|
|
0.05
|
|
|
48
|
|
|
—
|
|
|
3
|
|
|
3
|
|
|
4
|
|
|
37
|
|
|
Annual Asset Retirement Obligation Update (net of taxes of $7, $6
and $1, respectively)
|
|
0.02
|
|
|
20
|
|
|
—
|
|
|
—
|
|
|
—
|
|
|
16
|
|
|
4
|
|
|
Change in Environmental Liabilities (net of taxes of $0)
|
|
—
|
|
|
(1
|
)
|
|
—
|
|
|
—
|
|
|
—
|
|
|
—
|
|
|
(1
|
)
|
|
Gain on Contract Settlement (net of taxes of $20 and $19,
respectively)
|
|
(0.06
|
)
|
|
(55
|
)
|
|
—
|
|
|
—
|
|
|
—
|
|
|
—
|
|
|
(56
|
)
|
|
Reassessment of Deferred Income Taxes (entire amount represents tax
expense)
|
|
(0.02
|
)
|
|
(22
|
)
|
|
—
|
|
|
—
|
|
|
—
|
|
|
(7
|
)
|
|
(28
|
)
|
|
Noncontrolling Interests (net of taxes of $24)
|
|
(0.12
|
)
|
|
(113
|
)
|
|
—
|
|
|
—
|
|
|
—
|
|
|
—
|
|
|
(113
|
)
|
|
2018 Adjusted (non-GAAP) Operating Earnings
|
|
$
|
3.12
|
|
|
$
|
3,026
|
|
|
$
|
664
|
|
|
$
|
463
|
|
|
$
|
316
|
|
|
$
|
415
|
|
|
$
|
1,343
|
|
|
|
|
|
|
|
|
|
|
|
|
|
|
|
|
|
|
|
|
|
|
|
|
|
|
|
|
|
|
|
Adjusted (non-GAAP) Operating Earnings for the full year 2017 do not
include the following items (after tax) that were included in reported
GAAP Net Income:
|
(in millions)
|
|
ExelonEarnings per Diluted Share
|
|
Exelon
|
|
ComEd
|
|
PECO
|
|
BGE
|
|
PHI
|
|
Generation
|
|
2017 GAAP Net Income
|
|
$
|
3.99
|
|
|
$
|
3,786
|
|
|
$
|
567
|
|
|
$
|
434
|
|
|
$
|
307
|
|
|
$
|
362
|
|
|
$
|
2,710
|
|
|
Mark-to-Market Impact of Economic Hedging Activities (net of taxes
of $68 and $66, respectively)
|
|
0.11
|
|
|
107
|
|
|
—
|
|
|
—
|
|
|
—
|
|
|
—
|
|
|
109
|
|
|
Unrealized Gains Related to NDT Funds (net of taxes of $286)
|
|
(0.34
|
)
|
|
(318
|
)
|
|
—
|
|
|
—
|
|
|
—
|
|
|
—
|
|
|
(318
|
)
|
|
Amortization of Commodity Contract Intangibles (net of taxes of $22)
|
|
0.04
|
|
|
34
|
|
|
—
|
|
|
—
|
|
|
—
|
|
|
—
|
|
|
34
|
|
|
Merger and Integration Costs (net of taxes of $25, $0, $2, $2, $7
and $27, respectively)
|
|
0.04
|
|
|
40
|
|
|
1
|
|
|
2
|
|
|
2
|
|
|
(10
|
)
|
|
44
|
|
|
Merger Commitments (net of taxes of $137, $52 and $18, respectively)
|
|
(0.14
|
)
|
|
(137
|
)
|
|
—
|
|
|
—
|
|
|
—
|
|
|
(59
|
)
|
|
(18
|
)
|
|
Long-Lived Asset Impairments (net of taxes of $204, $9 and $194,
respectively)
|
|
0.34
|
|
|
321
|
|
|
—
|
|
|
—
|
|
|
—
|
|
|
16
|
|
|
306
|
|
|
Plant Retirements and Divestitures (net of taxes of $134 and $133,
respectively)
|
|
0.22
|
|
|
207
|
|
|
—
|
|
|
—
|
|
|
—
|
|
|
—
|
|
|
208
|
|
|
Cost Management Program (net of taxes of $21, $3, $3 and $15,
respectively)
|
|
0.04
|
|
|
34
|
|
|
—
|
|
|
4
|
|
|
5
|
|
|
—
|
|
|
25
|
|
|
Annual Asset Retirement Obligation Update (net of taxes of $1)
|
|
—
|
|
|
(2
|
)
|
|
—
|
|
|
—
|
|
|
—
|
|
|
—
|
|
|
(2
|
)
|
|
Vacation Policy Change (net of taxes of $21, $1, $1, $3 and $16,
respectively)
|
|
(0.03
|
)
|
|
(33
|
)
|
|
—
|
|
|
(1
|
)
|
|
(1
|
)
|
|
(5
|
)
|
|
(26
|
)
|
|
Change in Environmental Liabilities (net of taxes of $17)
|
|
0.03
|
|
|
27
|
|
|
—
|
|
|
—
|
|
|
—
|
|
|
—
|
|
|
27
|
|
|
Bargain Purchase Gain (net of taxes of $0)
|
|
(0.25
|
)
|
|
(233
|
)
|
|
—
|
|
|
—
|
|
|
—
|
|
|
—
|
|
|
(233
|
)
|
|
Gain on Deconsolidation of Business (net of taxes of $83)
|
|
(0.14
|
)
|
|
(130
|
)
|
|
—
|
|
|
—
|
|
|
—
|
|
|
—
|
|
|
(130
|
)
|
|
Like-Kind Exchange Tax Position (net of taxes of $66 and $9,
respectively)
|
|
(0.03
|
)
|
|
(26
|
)
|
|
23
|
|
|
—
|
|
|
—
|
|
|
—
|
|
|
—
|
|
|
Reassessment of Deferred Income Taxes (entire amount represents tax
expense)
|
|
(1.37
|
)
|
|
(1,299
|
)
|
|
1
|
|
|
(12
|
)
|
|
5
|
|
|
34
|
|
|
(1,856
|
)
|
|
Tax Settlements (net of taxes of $1)
|
|
(0.01
|
)
|
|
(5
|
)
|
|
—
|
|
|
—
|
|
|
—
|
|
|
—
|
|
|
(5
|
)
|
|
Noncontrolling Interests (net of taxes of $24)
|
|
0.12
|
|
|
114
|
|
|
—
|
|
|
—
|
|
|
—
|
|
|
—
|
|
|
114
|
|
|
2017 Adjusted (non-GAAP) Operating Earnings
|
|
$
|
2.62
|
|
|
$
|
2,487
|
|
|
$
|
592
|
|
|
$
|
427
|
|
|
$
|
318
|
|
|
$
|
338
|
|
|
$
|
989
|
|
|
|
|
|
|
|
|
|
|
|
|
|
|
|
|
|
|
|
|
|
|
|
|
|
|
|
|
|
|
|
Note:
Unless otherwise noted, the income tax impact of each reconciling item
between GAAP Net Income and Adjusted (non-GAAP) Operating Earnings is
based on the marginal statutory federal and state income tax rates for
each Registrant, taking into account whether the income or expense item
is taxable or deductible, respectively, in whole or in part. For all
items except the unrealized gains and losses related to NDT funds, the
marginal statutory income tax rates for 2018 and 2017 ranged from 26.0
percent to 29.0 percent and 39.0 percent to 41.0 percent, respectively.
Under IRS regulations, NDT fund returns are taxed at different rates for
investments if they are in qualified or non-qualified funds. The
effective tax rates for the unrealized gains and losses related to NDT
funds were 41.4 percent and 49.5 percent for the three months ended Dec.
31, 2018 and 2017, respectively; and were 46.2 percent and 47.4 percent
for the twelve months ended Dec. 31, 2018 and 2017, respectively.
Webcast Information
Exelon will discuss fourth quarter 2018 earnings in a one-hour
conference call scheduled for today at 9 a.m. Central Time (10 a.m.
Eastern Time). The webcast and associated materials can be accessed at www.exeloncorp.com/investor-relations.
About Exelon
Exelon Corporation (NYSE:EXC) is a Fortune 100 energy company with the
largest number of electricity and natural gas customers in the U.S.
Exelon does business in 48 states, the District of Columbia and Canada
and had 2018 revenue of $36 billion. Exelon serves approximately 10
million customers in Delaware, the District of Columbia, Illinois,
Maryland, New Jersey and Pennsylvania through its Atlantic City
Electric, BGE, ComEd, Delmarva Power, PECO and Pepco subsidiaries.
Exelon is one of the largest competitive U.S. power generators, with
more than 32,000 megawatts of nuclear, gas, wind, solar and
hydroelectric generating capacity comprising one of the nation's
cleanest and lowest-cost power generation fleets. The company's
Constellation business unit provides energy products and services to
approximately 2 million residential, public sector and business
customers, including more than two-thirds of the Fortune 100. Follow
Exelon on Twitter @Exelon.
Non-GAAP Financial Measures
In addition to net income as determined under generally accepted
accounting principles in the United States (GAAP), Exelon evaluates its
operating performance using the measure of Adjusted (non-GAAP) Operating
Earnings because management believes it represents earnings directly
related to the ongoing operations of the business. Adjusted (non-GAAP)
Operating Earnings exclude certain costs, expenses, gains and losses and
other specified items. This measure is intended to enhance an investor's
overall understanding of period over period operating results and
provide an indication of Exelon's baseline operating performance
excluding items that are considered by management to be not directly
related to the ongoing operations of the business. In addition, this
measure is among the primary indicators management uses as a basis for
evaluating performance, allocating resources, setting incentive
compensation targets and planning and forecasting of future
periods. Adjusted (non-GAAP) Operating Earnings is not a presentation
defined under GAAP and may not be comparable to other companies'
presentation. The Company has provided the non-GAAP financial measure as
supplemental information and in addition to the financial measures that
are calculated and presented in accordance with GAAP. Adjusted
(non-GAAP) Operating Earnings should not be deemed more useful than, a
substitute for, or an alternative to the most comparable GAAP Net Income
measures provided in this earnings release and attachments. This press
release and earnings release attachments provide reconciliations of
adjusted (non-GAAP) Operating Earnings to the most directly comparable
financial measures calculated and presented in accordance with GAAP, are
posted on Exelon's website: www.exeloncorp.com,
and have been furnished to the Securities and Exchange Commission on
Form 8-K on Feb 8, 2019.
Cautionary Statements Regarding Forward-Looking Information
This press release contains certain forward-looking statements within
the meaning of the Private Securities Litigation Reform Act of 1995,
that are subject to risks and uncertainties. The factors that could
cause actual results to differ materially from the forward-looking
statements made by the Registrants include those factors discussed
herein, as well as the items discussed in (1) the Registrants' 2017
Annual Report on Form 10-K in (a) ITEM 1A. Risk Factors, (b) ITEM 7.
Management's Discussion and Analysis of Financial Condition and Results
of Operations and (c) ITEM 8. Financial Statements and Supplementary
Data: Note 23, Commitments and Contingencies; (2) the Registrants' Third
Quarter 2018 Quarterly Report on Form 10-Q in (a) Part II, Other
Information, ITEM 1A. Risk Factors; (b) Part 1, Financial Information,
ITEM 2. Management's Discussion and Analysis of Financial Condition and
Results of Operations and (c) Part I, Financial Information, ITEM 1.
Financial Statements: Note 17, Commitments and Contingencies; and (3)
other factors discussed in filings with the SEC by the Registrants.
Readers are cautioned not to place undue reliance on these
forward-looking statements, which apply only as of the date of this
press release. None of the Registrants undertakes any obligation to
publicly release any revision to its forward-looking statements to
reflect events or circumstances after the date of this press release.
|
|
|
|
|
|
|
|
|
|
|
EXELON CORPORATION
|
|
GAAP Consolidated Statements of Operations and
|
|
Adjusted (non-GAAP) Operating Earnings Reconciling Adjustments
|
|
(unaudited)
|
|
(in millions, except per share data)
|
|
|
|
|
|
|
|
|
|
|
|
|
|
Three Months Ended December 31, 2018
|
|
|
|
Three Months Ended December 31, 2017 (b)
|
|
|
|
|
|
GAAP (a)
|
|
Non-GAAPAdjustments
|
|
|
|
GAAP (a)
|
|
Non-GAAPAdjustments
|
|
|
|
Operating revenues
|
|
$
|
8,814
|
|
|
$
|
166
|
|
|
(c)
|
|
$
|
8,384
|
|
|
$
|
93
|
|
|
(c),(e)
|
|
Operating expenses
|
|
|
|
|
|
|
|
|
|
|
|
|
|
Purchased power and fuel
|
|
4,296
|
|
|
21
|
|
|
(c),(g),(k)
|
|
3,508
|
|
|
61
|
|
|
(c),(e),(g)
|
|
Operating and maintenance
|
|
2,302
|
|
|
(38
|
)
|
|
(f),(g),(h)
|
|
2,368
|
|
|
(53
|
)
|
|
(f),(g),(h),(i),(l)
|
|
Depreciation and amortization
|
|
1,068
|
|
|
(112
|
)
|
|
(g)
|
|
1,015
|
|
|
(109
|
)
|
|
(g)
|
|
Taxes other than income
|
|
441
|
|
|
(1
|
)
|
|
(h)
|
|
418
|
|
|
2
|
|
|
(i)
|
|
Total operating expenses
|
|
8,107
|
|
|
|
|
|
|
7,309
|
|
|
|
|
|
|
Gain on sales of assets and businesses
|
|
1
|
|
|
—
|
|
|
|
|
—
|
|
|
—
|
|
|
|
|
Gain on deconsolidation of business
|
|
—
|
|
|
—
|
|
|
|
|
213
|
|
|
(213
|
)
|
|
(j)
|
|
Operating income
|
|
708
|
|
|
|
|
|
|
1,288
|
|
|
|
|
|
|
Other income and (deductions)
|
|
|
|
|
|
|
|
|
|
|
|
|
|
Interest expense, net
|
|
(416
|
)
|
|
15
|
|
|
(c)
|
|
(365
|
)
|
|
—
|
|
|
|
|
Other, net
|
|
(323
|
)
|
|
425
|
|
|
(c),(d)
|
|
304
|
|
|
(244
|
)
|
|
(d),(l)
|
|
Total other income and (deductions)
|
|
(739
|
)
|
|
|
|
|
|
(61
|
)
|
|
|
|
|
|
(Loss) income before income taxes
|
|
(31
|
)
|
|
|
|
|
|
1,227
|
|
|
|
|
|
|
Income taxes
|
|
(142
|
)
|
|
252
|
|
|
(c),(d),(g),(h),(k),(l)
|
|
(726
|
)
|
|
1,110
|
|
|
(c),(d),(e),(f),(g),(h),(i),(j),(l)
|
|
Equity in losses of unconsolidated affiliates
|
|
(6
|
)
|
|
—
|
|
|
|
|
(6
|
)
|
|
—
|
|
|
|
|
Net income
|
|
105
|
|
|
|
|
|
|
1,947
|
|
|
|
|
|
|
Net (loss) income attributable to noncontrolling interests
|
|
(47
|
)
|
|
77
|
|
|
(m)
|
|
67
|
|
|
(40
|
)
|
|
(m)
|
|
Net income attributable to common shareholders
|
|
$
|
152
|
|
|
|
|
|
|
$
|
1,880
|
|
|
|
|
|
|
Effective tax rate(n)(o)
|
|
458.1
|
%
|
|
|
|
|
|
(59.2
|
)%
|
|
|
|
|
|
Earnings per average common share
|
|
|
|
|
|
|
|
|
|
|
|
|
|
Basic
|
|
$
|
0.16
|
|
|
|
|
|
|
$
|
1.95
|
|
|
|
|
|
|
Diluted
|
|
$
|
0.16
|
|
|
|
|
|
|
$
|
1.94
|
|
|
|
|
|
|
Average common shares outstanding
|
|
|
|
|
|
|
|
|
|
|
|
|
|
Basic
|
|
969
|
|
|
|
|
|
|
964
|
|
|
|
|
|
|
Diluted
|
|
971
|
|
|
|
|
|
|
967
|
|
|
|
|
|
|
Effect of adjustments on earnings per average diluted common
share recorded in accordance with GAAP:
|
|
Mark-to-market impact of economic hedging activities (c)
|
|
$
|
0.19
|
|
|
|
|
|
|
$
|
0.01
|
|
|
|
|
Unrealized (gains) losses related to NDT funds (d)
|
|
0.25
|
|
|
|
|
|
|
(0.11
|
)
|
|
|
|
Amortization of commodity contract intangibles (e)
|
|
—
|
|
|
|
|
|
|
0.01
|
|
|
|
|
Long-lived asset impairments (f)
|
|
—
|
|
|
|
|
|
|
0.03
|
|
|
|
|
Plant retirements and divestitures (g)
|
|
0.10
|
|
|
|
|
|
|
0.07
|
|
|
|
|
Cost management program (h)
|
|
0.02
|
|
|
|
|
|
|
0.01
|
|
|
|
|
Vacation policy change (i)
|
|
—
|
|
|
|
|
|
|
(0.03
|
)
|
|
|
|
Change in environmental liabilities
|
|
—
|
|
|
|
|
|
|
0.03
|
|
|
|
|
Gain on deconsolidation of business (j)
|
|
—
|
|
|
|
|
|
|
(0.14
|
)
|
|
|
|
Gain on contract settlement (k)
|
|
(0.06
|
)
|
|
|
|
|
|
—
|
|
|
|
|
Reassessment of deferred income taxes (l)
|
|
—
|
|
|
|
|
|
|
(1.30
|
)
|
|
|
|
Noncontrolling interests (m)
|
|
(0.08
|
)
|
|
|
|
|
|
0.04
|
|
|
|
|
Total adjustments
|
|
$
|
0.42
|
|
|
|
|
|
|
$
|
(1.38
|
)
|
|
|
|
(a)
|
|
Results reported in accordance with accounting principles generally
accepted in the United States (GAAP).
|
|
(b)
|
|
Certain immaterial prior year amounts in the Registrants'
Consolidated Statements of Operations and Comprehensive Income have
been recasted to reflect new accounting standards issued by the FASB
and adopted as of January 1, 2018.
|
|
(c)
|
|
Adjustment to exclude the mark-to-market impact of Exelon's economic
hedging activities, net of intercompany eliminations.
|
|
(d)
|
|
Adjustment to exclude impact of net unrealized gains and losses on
Generation's NDT funds for Non-Regulatory and Regulatory Agreement
Units. The impacts of the Regulatory Agreement Units, including the
associated income taxes, are contractually eliminated, resulting in
no earnings impact.
|
|
(e)
|
|
Adjustment to exclude the non-cash amortization of intangible
assets, net, primarily related to commodity contracts recorded at
fair value related to the ConEdison Solutions and FitzPatrick
acquisitions.
|
|
(f)
|
|
Adjustment to exclude primarily charges to earnings related to the
PHI impairment of the District of Columbia sponsorship intangible
asset.
|
|
(g)
|
|
Adjustment to exclude primarily accelerated depreciation and
amortization expenses associated with Generation's decision to early
retire the Three Mile Island nuclear facility.
|
|
(h)
|
|
Adjustment to exclude primarily severance and reorganization costs
related to a cost management program.
|
|
(i)
|
|
Adjustment to exclude the reversal of previously accrued vacation
expenses as a result of a change in Exelon's vacation vesting policy.
|
|
(j)
|
|
Adjustment to exclude the gain recorded upon deconsolidation of
ExGen Texas Power, LLC (EGTP) net liabilities, which included the
previously impaired assets and related debt, as a result of the
November 2017 bankruptcy filing.
|
|
(k)
|
|
Adjustment to exclude the gain on the settlement of a long-term gas
supply agreement at Generation.
|
|
(l)
|
|
Adjustment to exclude in 2017, the one-time non-cash impacts
associated with the Tax Cuts and Jobs Act (TCJA) (including impacts
on pension obligations contained within Other) and in 2018, an
adjustment to the remeasurement of deferred income taxes as a result
of TCJA and changes in forecasted apportionment.
|
|
(m)
|
|
Adjustment to exclude the elimination from Generation's results of
the noncontrolling interest related to certain exclusion items,
primarily related to the impact of unrealized gains and losses on
NDT funds at CENG.
|
|
(n)
|
|
The effective tax rate related to GAAP Net Income for the three
months ended December 31, 2018 includes the impact of the Tax Cuts
and Jobs Act.
|
|
(o)
|
|
The effective tax rate related to Adjusted (non-GAAP) Operating
Earnings is 15.6% and 39.9% for the three months ended December 31,
2018 and 2017, respectively.
|
|
|
|
|
|
|
|
|
|
|
|
|
|
|
|
EXELON CORPORATION
|
|
GAAP Consolidated Statements of Operations and
|
|
Adjusted (non-GAAP) Operating Earnings Reconciling Adjustments
|
|
(unaudited)
|
|
(in millions, except per share data)
|
|
|
|
|
|
|
|
|
|
|
|
|
|
Twelve Months Ended December 31, 2018
|
|
|
|
Twelve Months Ended December 31, 2017 (b)
|
|
|
|
|
|
GAAP (a)
|
|
Non-GAAPAdjustments
|
|
|
|
GAAP (a)
|
|
Non-GAAPAdjustments
|
|
|
|
Operating revenues
|
|
$
|
35,985
|
|
|
$
|
263
|
|
|
(c)
|
|
$
|
33,565
|
|
|
$
|
170
|
|
|
(c),(e)
|
|
Operating expenses
|
|
|
|
|
|
|
|
|
|
|
|
|
|
Purchased power and fuel
|
|
16,670
|
|
|
(38
|
)
|
|
(c),(i),(o)
|
|
14,035
|
|
|
(72
|
)
|
|
(c),(e),(i)
|
|
Operating and maintenance
|
|
9,337
|
|
|
(272
|
)
|
|
(f),(h),(i),(j),(k)
|
|
10,025
|
|
|
(686
|
)
|
|
(f),(h),(i),(j),(k),(l),(q)
|
|
Depreciation and amortization
|
|
4,353
|
|
|
(553
|
)
|
|
(i)
|
|
3,828
|
|
|
(252
|
)
|
|
(e),(i)
|
|
Taxes other than income
|
|
1,783
|
|
|
(1
|
)
|
|
(j)
|
|
1,731
|
|
|
2
|
|
|
(l)
|
|
Total operating expenses
|
|
32,143
|
|
|
|
|
|
|
29,619
|
|
|
|
|
|
|
Gain on sales of assets and businesses
|
|
56
|
|
|
(48
|
)
|
|
(i)
|
|
3
|
|
|
1
|
|
|
(i)
|
|
Bargain purchase gain
|
|
—
|
|
|
—
|
|
|
|
|
233
|
|
|
(233
|
)
|
|
(m)
|
|
Gain on deconsolidation of business
|
|
—
|
|
|
—
|
|
|
|
|
213
|
|
|
(213
|
)
|
|
(n)
|
|
Operating income
|
|
3,898
|
|
|
|
|
|
|
4,395
|
|
|
|
|
|
|
Other income and (deductions)
|
|
|
|
|
|
|
|
|
|
|
|
|
|
Interest expense, net
|
|
(1,554
|
)
|
|
25
|
|
|
(c)
|
|
(1,560
|
)
|
|
58
|
|
|
(h),(p),(r)
|
|
Other, net
|
|
(112
|
)
|
|
625
|
|
|
(c),(d)
|
|
947
|
|
|
(638
|
)
|
|
(d),(p),(q)
|
|
Total other income and (deductions)
|
|
(1,666
|
)
|
|
|
|
|
|
(613
|
)
|
|
|
|
|
|
Income before income taxes
|
|
2,232
|
|
|
|
|
|
|
3,782
|
|
|
|
|
|
|
Income taxes
|
|
120
|
|
|
600
|
|
|
(c),(d),(f),(h),(i),(j),(k),(o),(q)
|
|
(126
|
)
|
|
1,566
|
|
|
(c),(d),(e),(f),(g),(h),(i),(j),(k),(l),(n),(p),(q),(r)
|
|
Equity in losses of unconsolidated affiliates
|
|
(28
|
)
|
|
—
|
|
|
|
|
(32
|
)
|
|
—
|
|
|
|
|
Net income
|
|
2,084
|
|
|
|
|
|
|
3,876
|
|
|
|
|
|
|
Net income attributable to noncontrolling interests
|
|
74
|
|
|
113
|
|
|
(s)
|
|
90
|
|
|
(114
|
)
|
|
(s)
|
|
Net income attributable to common shareholders
|
|
$
|
2,010
|
|
|
|
|
|
|
$
|
3,786
|
|
|
|
|
|
|
Effective tax rate(t)(u)
|
|
5.4
|
%
|
|
|
|
|
|
(3.3
|
)%
|
|
|
|
|
|
Earnings per average common share
|
|
|
|
|
|
|
|
|
|
|
|
|
|
Basic
|
|
$
|
2.08
|
|
|
|
|
|
|
$
|
4.00
|
|
|
|
|
|
|
Diluted
|
|
$
|
2.07
|
|
|
|
|
|
|
$
|
3.99
|
|
|
|
|
|
|
Average common shares outstanding
|
|
|
|
|
|
|
|
|
|
|
|
|
|
Basic
|
|
967
|
|
|
|
|
|
|
947
|
|
|
|
|
|
|
Diluted
|
|
969
|
|
|
|
|
|
|
949
|
|
|
|
|
|
|
Effect of adjustments on earnings per average diluted common
share recorded in accordance with GAAP:
|
|
Mark-to-market impact of economic hedging activities (c)
|
|
$
|
0.26
|
|
|
|
|
|
|
$
|
0.11
|
|
|
|
|
Unrealized losses (gains) related to NDT funds (d)
|
|
0.35
|
|
|
|
|
|
|
(0.34
|
)
|
|
|
|
Amortization of commodity contract intangibles (e)
|
|
—
|
|
|
|
|
|
|
0.04
|
|
|
|
|
Merger and integration costs (f)
|
|
—
|
|
|
|
|
|
|
0.04
|
|
|
|
|
Merger commitments (g)
|
|
—
|
|
|
|
|
|
|
(0.14
|
)
|
|
|
|
Long-lived asset impairments (h)
|
|
0.04
|
|
|
|
|
|
|
0.34
|
|
|
|
|
Plant retirements and divestitures (i)
|
|
0.53
|
|
|
|
|
|
|
0.22
|
|
|
|
|
Cost management program (j)
|
|
0.05
|
|
|
|
|
|
|
0.04
|
|
|
|
|
Annual asset retirement obligation update (k)
|
|
0.02
|
|
|
|
|
|
|
—
|
|
|
|
|
Vacation policy change (l)
|
|
—
|
|
|
|
|
|
|
(0.03
|
)
|
|
|
|
Change in environmental liabilities
|
|
—
|
|
|
|
|
|
|
0.03
|
|
|
|
|
Bargain purchase gain (m)
|
|
—
|
|
|
|
|
|
|
(0.25
|
)
|
|
|
|
Gain on deconsolidation of business (n)
|
|
—
|
|
|
|
|
|
|
(0.14
|
)
|
|
|
|
Gain on contract settlement (o)
|
|
(0.06
|
)
|
|
|
|
|
|
—
|
|
|
|
|
Like-kind exchange tax position (p)
|
|
—
|
|
|
|
|
|
|
(0.03
|
)
|
|
|
|
Reassessment of deferred income taxes (q)
|
|
(0.02
|
)
|
|
|
|
|
|
(1.37
|
)
|
|
|
|
Tax settlements (r)
|
|
—
|
|
|
|
|
|
|
(0.01
|
)
|
|
|
|
Noncontrolling interests (s)
|
|
(0.12
|
)
|
|
|
|
|
|
0.12
|
|
|
|
|
Total adjustments
|
|
$
|
1.05
|
|
|
|
|
|
|
$
|
(1.37
|
)
|
|
|
|
(a)
|
|
Results reported in accordance with accounting principles generally
accepted in the United States (GAAP).
|
|
(b)
|
|
Certain immaterial prior year amounts in the Registrants'
Consolidated Statements of Operations and Comprehensive Income have
been recasted to reflect new accounting standards issued by the FASB
and adopted as of January 1, 2018.
|
|
(c)
|
|
Adjustment to exclude the mark-to-market impact of Exelon's economic
hedging activities, net of intercompany eliminations.
|
|
(d)
|
|
Adjustment to exclude impact of net unrealized gains and losses on
Generation's NDT funds for Non-Regulatory and Regulatory Agreement
Units. The impacts of the Regulatory Agreement Units, including the
associated income taxes, are contractually eliminated, resulting in
no earnings impact.
|
|
(e)
|
|
Adjustment to exclude the non-cash amortization of intangible
assets, net, primarily related to commodity contracts recorded at
fair value related to the ConEdison Solutions and FitzPatrick
acquisitions.
|
|
(f)
|
|
Adjustment to exclude certain costs associated with mergers and
acquisitions, including, if and when applicable, professional fees,
employee-related expenses and integration activities. In 2017,
reflects costs related to the PHI and FitzPatrick acquisitions,
offset at PHI by the anticipated recovery of previously incurred PHI
acquisition costs.
|
|
(g)
|
|
Adjustment to exclude in 2017, primarily a decrease in reserves for
uncertain tax positions related to the deductibility of certain
merger commitments associated with the 2012 CEG and 2016 PHI
acquisitions.
|
|
(h)
|
|
Adjustment to exclude in 2017, primarily charges to earnings related
to the impairment of the ExGen Texas Power, LLC (EGTP) assets held
for sale and PHI District of Columbia sponsorship intangible asset
and in 2018, primarily the impairment of certain wind projects at
Generation.
|
|
(i)
|
|
Adjustment to exclude in 2017, primarily accelerated depreciation
and amortization expenses and one-time charges associated with
Generation's previous decision to early retire the Three Mile Island
nuclear facility. In 2018, primarily accelerated depreciation and
amortization expenses and one-time charges associated with
Generation's decision to early retire the Oyster Creek nuclear
facility, a charge associated with a remeasurement of the Oyster
Creek Asset Retirement Obligation (ARO) and accelerated depreciation
and amortization expenses associated with the 2017 decision to early
retire the Three Mile Island nuclear facility, partially offset by a
gain associated with Generation's sale of its electrical contracting
business.
|
|
(j)
|
|
Adjustment to exclude primarily severance and reorganization costs
related to a cost management program.
|
|
(k)
|
|
Adjustment to exclude for Pepco, an increase related to asbestos
identified at its Buzzard Point property.
|
|
(l)
|
|
Adjustment to exclude the reversal of previously accrued vacation
expenses as a result of a change in Exelon's vacation vesting policy.
|
|
(m)
|
|
Adjustment to exclude the excess of the fair value of assets and
liabilities acquired over the purchase price for the FitzPatrick
acquisition.
|
|
(n)
|
|
Adjustment to exclude the gain recorded upon deconsolidation of
EGTP's net liabilities, which included the previously impaired
assets and related debt, as a result of the November 2017 bankruptcy
filing.
|
|
(o)
|
|
Adjustment to exclude the gain on the settlement of a long-term gas
supply agreement at Generation.
|
|
(p)
|
|
Adjustment to exclude adjustments to income tax, penalties and
interest expenses as a result of the finalization of the IRS tax
computation related to Exelon's like-kind exchange tax position.
|
|
(q)
|
|
Adjustment to exclude in 2017, one-time non-cash impacts associated
with remeasurements of deferred income taxes as a result of the Tax
Cuts and Jobs Act (TCJA) (including impacts on pension obligations
contained within Other), changes in the Illinois and District of
Columbia statutory tax rates and changes in forecasted
apportionment. In 2018, an adjustment to the remeasurement of
deferred income taxes as a result of the TCJA and changes in
forecasted apportionment.
|
|
(r)
|
|
Adjustment to exclude benefits related to the favorable settlement
in 2017 of certain income tax positions related to PHI's unregulated
business interests.
|
|
(s)
|
|
Adjustment to exclude elimination from Generation's results of the
noncontrolling interests related to certain exclusion items,
primarily related to the impact of unrealized gains and losses on
NDT funds at CENG.
|
|
(t)
|
|
The effective tax rate related to GAAP Net Income for the twelve
months ended December 31, 2018 includes the impact of the TCJA.
|
|
(u)
|
|
The effective tax rate related to Adjusted (non-GAAP) Operating
Earnings is 18.2% and 36.6% for the twelve months ended December 31,
2018 and 2017, respectively.
|

View source version on businesswire.com: https://www.businesswire.com/news/home/20190208005190/en/
