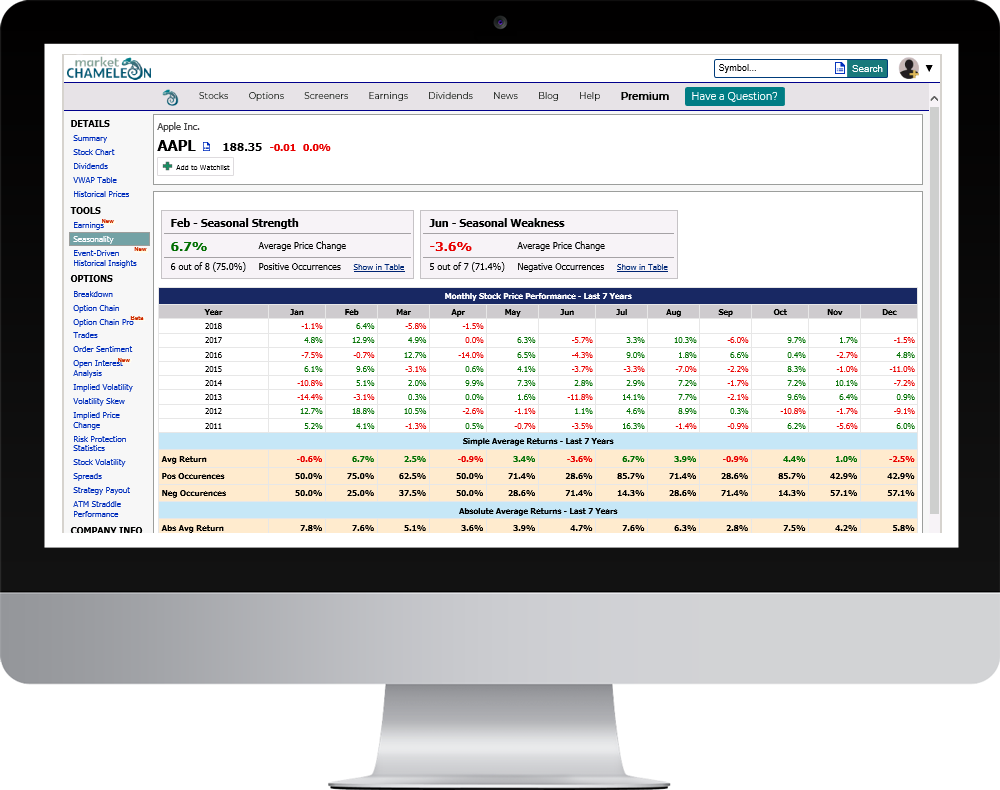
Month-by-month performance of Nextera Energy 7.234% Corporate Units (NEE-T) stock: average returns, win rates and the best and worst months to hold it.
For the latest figures, see NEE-T stock summary.
Determine Best and Worst seasonal strength months and average Price Changes for each month over the past 7 years. Quickly detect historical price patterns, percentage win rates, and median, minimum and maximum statistics by month. Click here to learn more about Monthly Seasonality.
▲ Close