A price return distribution can be an extremely useful tool to traders to help quickly access a stocks potential risks and returns over a set time period. The performance of a stock can be viewed on a historical basis isolating the frequency of returns positive/negative over a selected time interval.
Helps Stock Traders
Helps Options Traders
From the main menu go to Stocks > Historical Price Return Distribution (or Click Here)
The screenshot below shows the inputs for IWM daily returns over a 2 year history.

The screenshot below shows the results for insights for IWM daily returns over a 2 year history.

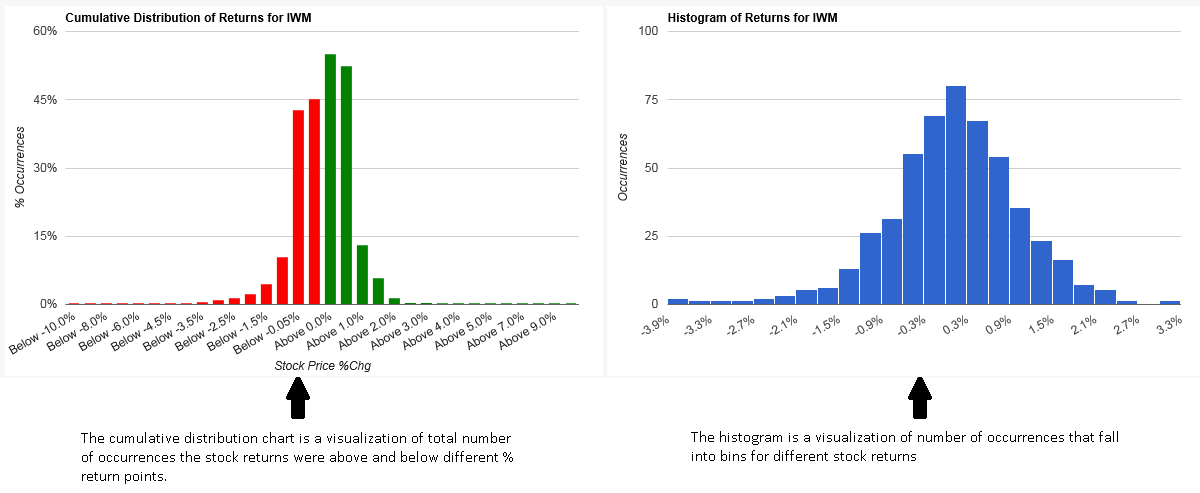
The screenshot below shows the two distribution charts you will see below the insights.

This example shows that extreme moves in IWM were ±2% with positive gains of 2% or more happening 1.4% of the time while negative returns -2% and below happening 2.2% over the 2 year history.
Example of a quick check on the historical price return distribution page

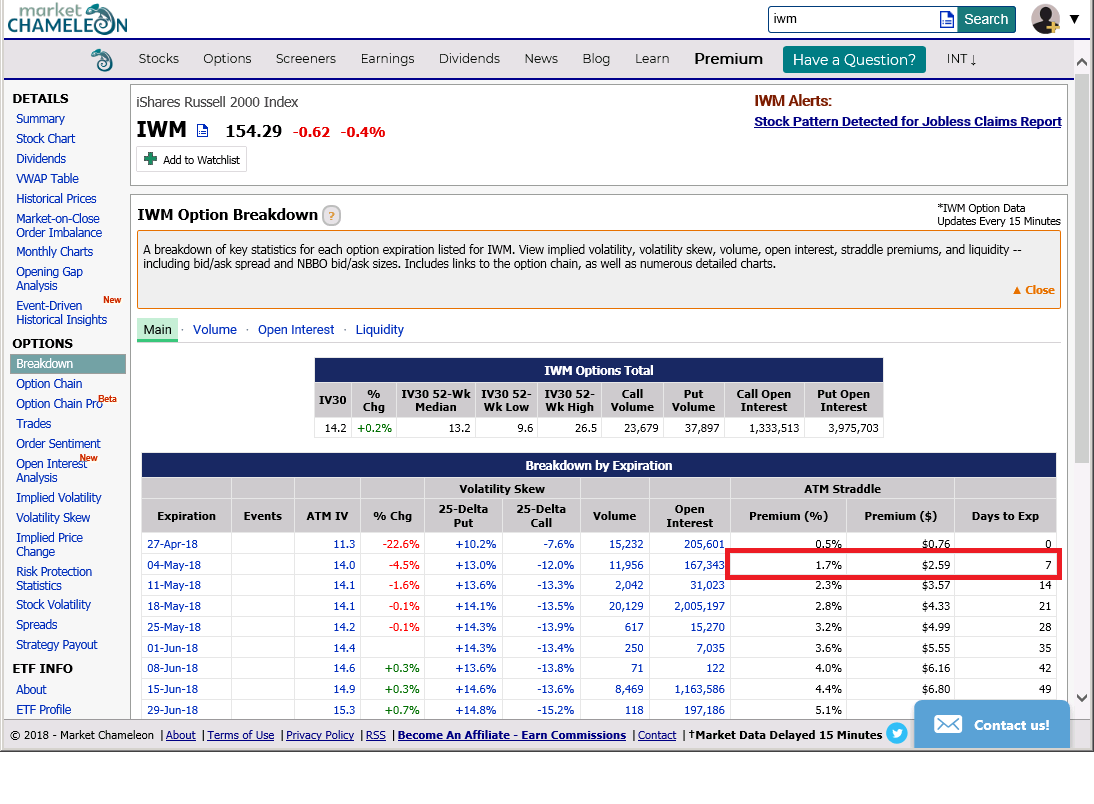
Highlighted above is a straddle with a premium of 1.7% and 7 days to expiration for IWM, which can be found in the option breakdown page.
Entering a 7 day rolling period for IWM using 2 years of historical prices and entering a 1.7% move in the quick check shows, in the last 2 years, the number of occurrences above 1.7% (3.6%) and below 1.7% (3.2%).
