| Description | Data | Note |
|---|---|---|
| Policies issued | 1,000 | 3 years of historical data |
| Total payout at end of policies | $1,000,000 | on 100 claims |
| Average payout per policy | $1,000 | $1,000,000 in payouts / 1,000 policies issued |
Conclusion, the long-term average value or break-even per policy is $1,000. This is the theoretical value.

The Theoretical Value
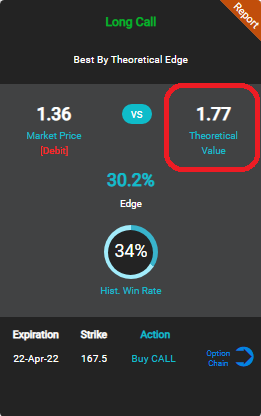
The theoretical value is displayed to the right of the current market value. Making it easy to see where the current market is pricing the trade vs the value that has been compiled and calculated from historical data.| Description | Data | Note |
|---|---|---|
| Market Price | $1500 | Avg Premium Per Policy |
| Theoretical Value | $1000 | Avg Payout |
| Theoretical Edge | $500 | Avg Profit |

How it's Calculated
| Find your edge in terms of capital |
|
||||||||
| Find your capital at risk |
|
||||||||
| Finally, the Theoretical Edge (in terms of percent of capital at risk) calculation |
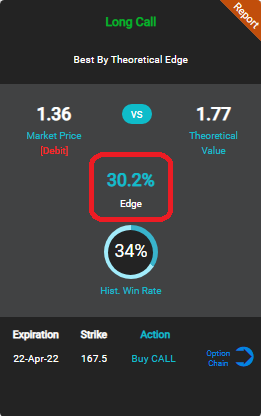
Theoretical Edge / Capital at Risk 0.41 / 1.36 = 30.2% |
The Theoretical Edge
The theoretical edge is perhaps the most important section of the trade card, this is where you can find how much theoretical edge you have based on calculations from historical data. Just like in the insurance company example, this is the expected average return per trade in the long term (assuming the historical price return distributions of the stock are the same in the future).| Description | Data | Note |
|---|---|---|
| Policies Issued | 1,000 | |
| Claims | 100 | |
| Win Rate | 90% | (1000 policies - 100 claims) / 1000 policies |

The Win Rate
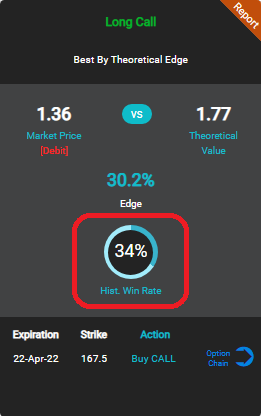
The win rate simply shows you the percentage of times this type of trade was profitable over a 6 year historical time frame. If you think of each trade card as a policy, then the win rate would show you how many times the policy expired without a payout on a claim.