Trading volume usually increases when a company reports earnings because this is a major binary event. If you are considering a trade set up, a look back at historical stock moves around earnings can give you insights how the stock behaved in the past. Market Chameleon Historical Stock Price Moves Around Earnings report helps you get a perspective of a stocks historical return distribution around earnings.
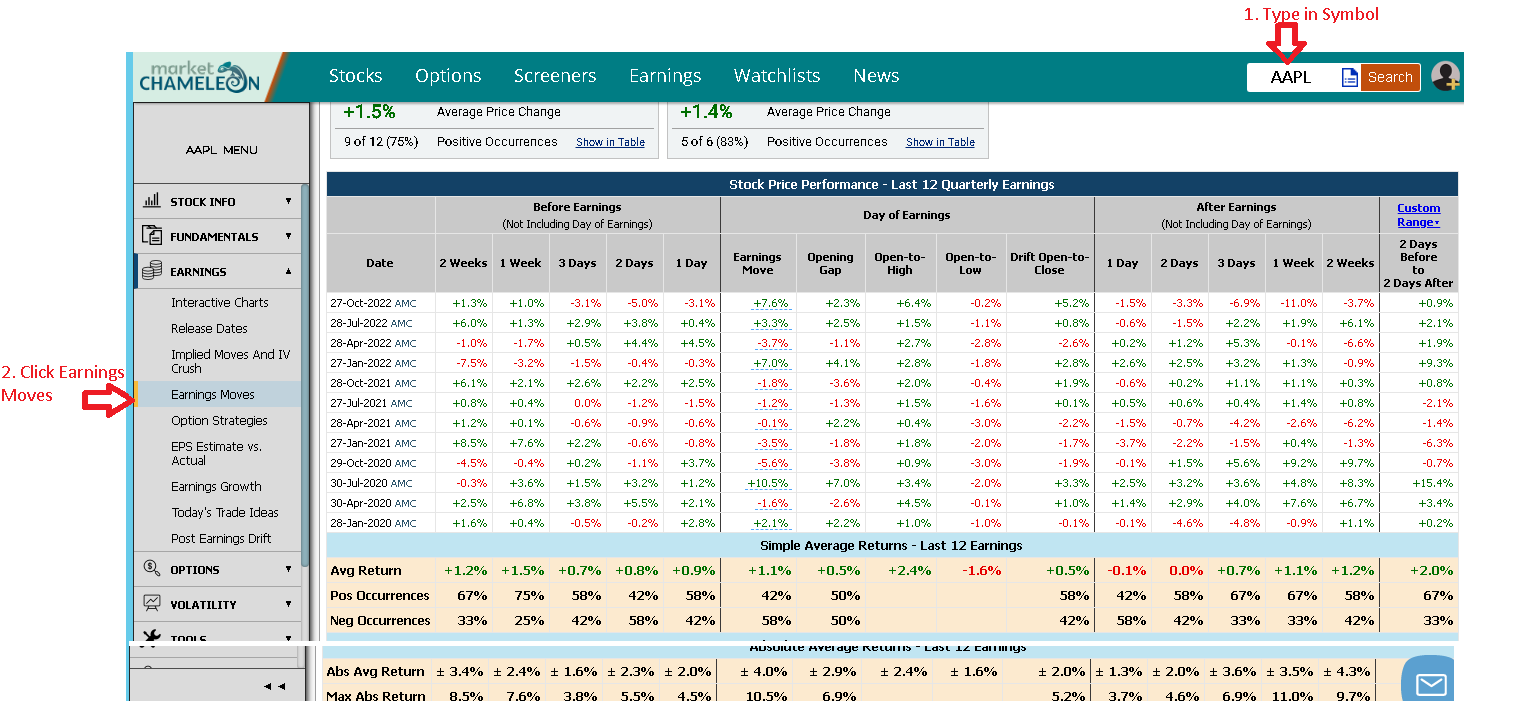
1. Type in a symbol in the search box and then click Search. As you can see, in the image the symbol AAPL was entered.
2. After you type in the symbol, you will arrive at the main page (AAPL in this example). Select Stock Patterns from the left hand side menu bar as shown in the image.