Site Features

Symbol Links

Option Chain

Advanced Stock Chart

Historical Price Return Distribution Report

Forward-Looking Earnings Dates Report

Recent Dividend Announcements and Guidance Report

Future Ex-Dividend Dates Report

Option Repeat Trade Screener

Option Order Flow Sentiment Screener

Week-by-Week ATM Straddle Performance Report

Symbol ATM Straddle Performance

Seasonality Screener By Calendar Month

Seasonality Monitor By Calendar Month

Earnings Stock Pattern Screener

Earnings Option Strategy Screener

Event-Driven Historical Insights

At-the-Money Option Straddle Screener

Large Dollar Volume Burst Trades

Option Contract Analytics

Option Contract Historical Data Analytics

Option Contract Implied Volatility Chart

Option Contract Time And Sales

Option Contract Single-Leg Trades

Option Contract Multi-Leg Trades

Unusual Options Activty

How to use the earnings calendar

How do I cancel my subscription?

Glossary

Glossary

Financial Concepts

Stocks vs. Options

Dividends

Earnings

ETFs and ETNs

Bid-Ask Spread

Theoretical Edge

Relative Strength Performance

Stock Seasonality

Payout Diagrams

Option Delta Volume

Options Basics

Introduction

Brokerage Account

Option Chain

Open Interest

Delta

Gamma

Theta

Vega

Rho

Volatility

Skew

Cost of Carry

Option FAQs

Options Trading

Option Strategies Overview

Put Protection

Buy-Write

Synthetic Stock Positions

Delta Neutral Trading

Multi-Leg Option Trade Analyzer

Multi-Leg Option Trades Screener

Misc.

Stock Order Imbalance

Threshold List

How To

How to Trade Around Earnings

How to Find a Bull Call Spread for a Specific Stock

How to Use an Options Profit Calculator

How to Find a Stocks Historical Price Moves Around Earnings

How to Subscribe to Market Chameleon from Interactive Brokers

Time And Sales for an Option Contract

The Time And Sales feature on Market Chameleon offers a detailed view of all trades executed in a specific option contract throughout the day. This tool provides granular insights into each trade’s dynamics, helping traders analyze market activity in real time.
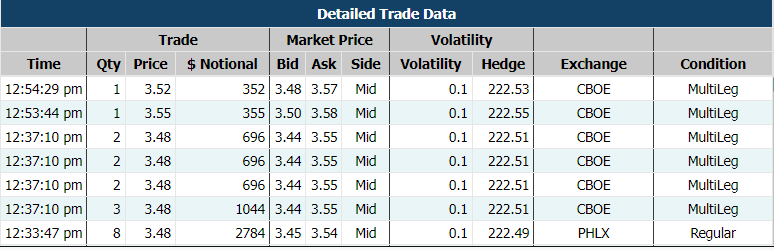
Learn about the time and sales of an option contract

Key Insights:

  • Timestamped Trades: View the exact time each trade occurred, giving you a precise sequence of events.
  • Trade Details: Access information about the quantity, price, and notional value of each trade.
  • Bid-Ask at Trade Time: See the market’s bid and ask prices when the trade was executed, offering clarity on where the trade occurred within the spread.
  • Side of Market: Understand whether the trade executed on the bid or ask side, helping you gauge market sentiment.
  • Implied Volatility: Track the implied volatility (IV) level of each trade to study how volatility evolved throughout the day.
  • Hedge or Reference Price: Review the underlying asset’s price at the time of the trade to assess market conditions and potential hedging strategies.
  • Exchange & Trade Conditions: Identify the exchange where the trade occurred and any special conditions, such as multi-leg or contingent trades.

This feature provides traders with valuable tools to:

  • Spot unusual trading activity or patterns, such as trade clustering at specific times.
  • Analyze trade dynamics, including volatility shifts, spread movements, and multi-leg strategies.
  • Monitor liquidity and execution quality by comparing trades against market conditions at the time.

With Market Chameleon's Time & Sales feature, traders gain a comprehensive view of how trading in a particular option unfolds, offering insights that enhance their ability to make informed decisions and react to market developments.

Market Data Delayed 15 Minutes