The Option Repeat Trade Screener enables our users to find options in the marketplace which have had repeated large trading interest throughout the trading day. It consolidates several features of the Option Block Trade Screener into one report which shows the combined value of trading for options that have had multiple large trades.
The screener is found as a separate tab within the Option Block Trade Screener, which can be accessed from the Screeners menu item at the top of the screen. Just click on the tab item that says Repeat Trade Screener.
The initial display of the screener shows each option with summarized results of all the block option trading that meets the requirements indicated by the filters. You can change the filters to change the baseline requirements of these results, more on that below.
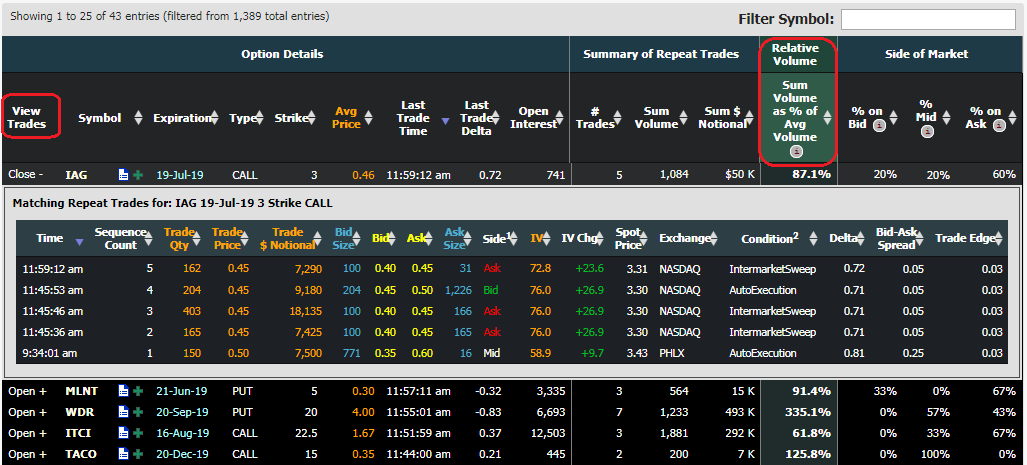
The summary view gives you a consolidated reference for the day's large block trading in that option -- how many times has it traded, what's the total quantity, what's the total notional amount, the average price, and, importantly, the Relative Volume versus the average. This column presents the summed volume of the matching trades for that option as a percentage of the average daily trading volume for the entire underlying symbol. Why is this important? Larger figures mean that traders are placing an exceedingly unusual amount of interest on one option. If a symbol typically trades ony 5,000 contracts daily but it has already traded more than 10,000 shares on a single option today, that would be noteworthy. And this report is separate from the Block Trade Screener because it groups the trading -- those 10,000 shares might have happened across 50 or 100 different trades. In the Block Trade Screener it might go unnoticed -- thus the benefit of showing repeat summary totals.
To get a more detailed look each trade within the option's summary, click on the Open + link in the first column of the table. There, you'll see a list of all the matching trades, per the filters.

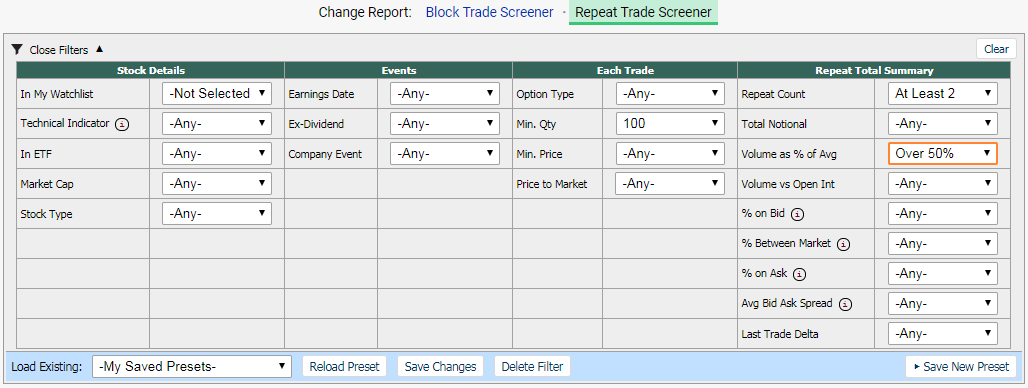
Stock Details lets you filter out certain symbols from the underlying stock, like using those symbols in any of your custom watchlists, or that are currently listed as holdings in market ETFs, or that have a certain market cap or stock type.
Events lets you decide if you want to see only options that have earnings dates before expiration, or ex-dividend dates, or company events.
Each Trade filters establishes the base level of trading data for the report to be built from. Initially, you'll see option trades that have traded at least 100 contracts in each trade. So you might see one result in the table that shows 8 trades for 1,000 total volume. If you decide that 100 contracts is not enough, you can change that filter to show only summaries of trades that were over 200 contracts, or 500, or 1,000. But the results that you see would then change. That same option from before showing 8 trades at 100 contracts per trade, might only show 3 trades at 200 contracts per trade.
Each Trade also lets you select the Minimum Price for the trades and whether the trade price sat on or below the bid price, on or above the ask price, or in between (Price to Market).
Repeat Total Summary filters will then filter down the remaining summaries in the table. Perhaps you only want to see options that have traded at least 5 times with the matching criteria, you can use Repeat Count to select that. Or you can find options that have traded a particularly large amount on or below the bid, or on or above the ask price.
The Volume as % of Avg filter enables you to pick only options that have traded an unusually large amount today relative to the symbol's average daily volume.
The screenshot below shows a sample of the filters available:

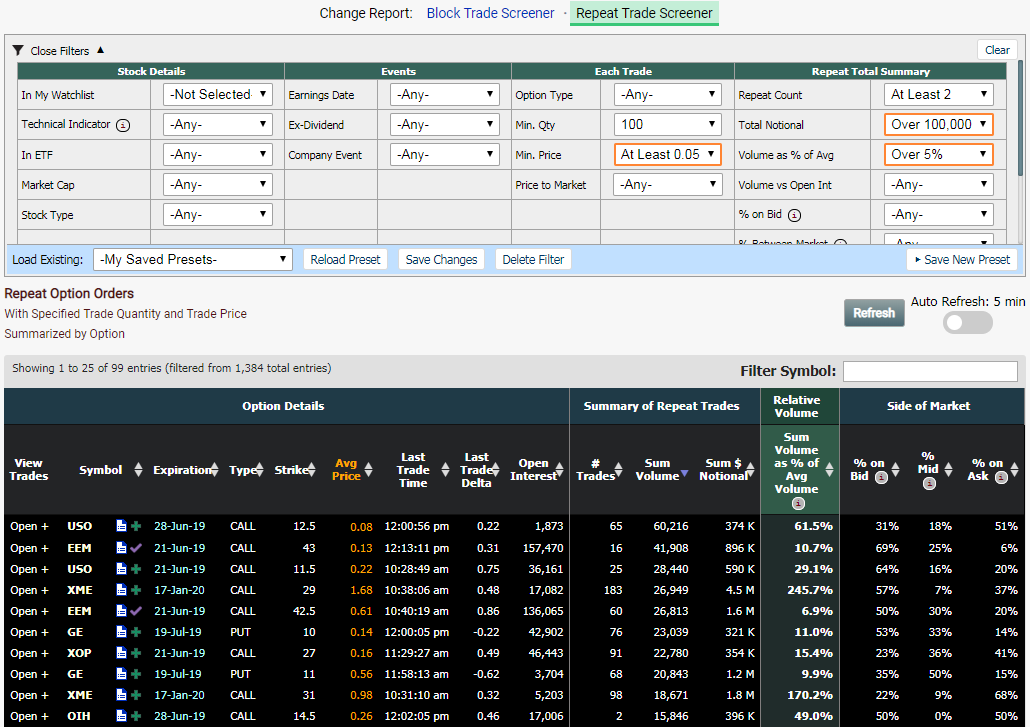
Here's a screenshot of a sample result set from this screener, with a selection of filters enabled:
