Unlike a stock that has a single consolidated bid and ask quote, options on a stock come in many different flavors. There are puts and calls, different strikes and different expiration months on many option contracts. Given that there can be hundreds or even thousands of different option contracts available for trading on the same underlying asset, it can be challenging to organize them all into a coherent presentation where they can be compared side by side. The typical approach is to display options in a table which contains all options for a given expiration. This is called the Option Chain or the Option Montage.
While browsing stock-specific data, there is a series of links running along the left edge of the page. Clicking on "Option Chain" on the left edge will display the Option Chain for that stock. Alternatively, to view the Option Chain right now for a specific symbol, enter it in the field below and click "View Option Chain". If your stock's symbol is not visible in the field below or the Option Chain menu choice is not visible in the left-side menu, it's likely that there aren't any options available for the chosen symbol.
By default the Option Chain is displayed for the latest business date, however Options Trader and Premium All-In-One subscribers can select a historical date from a drop-down labelled "Load Option Chain for Previous Dates".


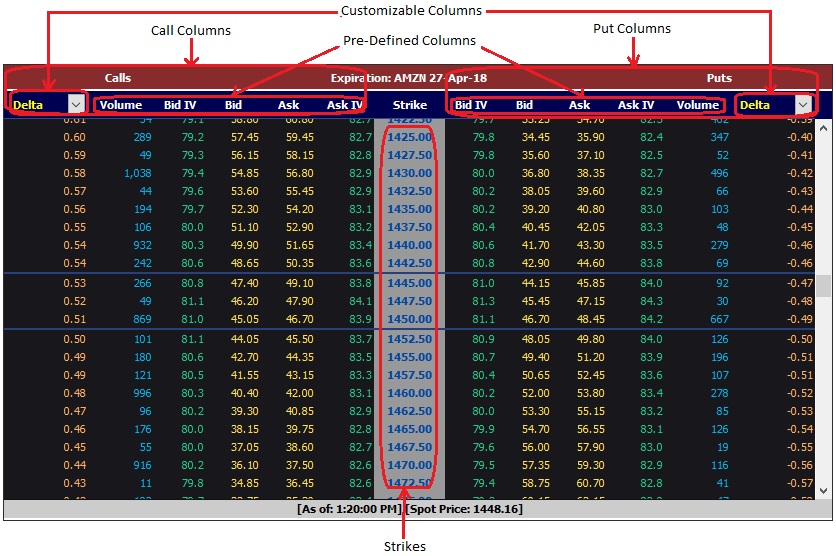
Market Chameleon's Option Chain presents a wealth of information to the user without it becoming overwhelming. A specific row in the option chain table contains call and put information for a given strike. The call is displayed on the left and the put on the right. The strike price is displayed prominently in the middle - between the call information and the put information. This presentation makes it easy to see the call and corresponding put side by side and view the strikes going up by ascending order. The At-The-Money strikes are enclosed in a black frame.
The pre-defined columns in the Option Chain are volume, bid implied vol, bid quote ask quote and ask implied vol. There is also a customizable column on the left and right edges that can be toggled by the user using the drop-down to display one of the following analytics for each strike:
Options Trader and All-In-One Premium subscribers can download the information into a CSV file which is easily loaded into MS Excel and other analysis tools.

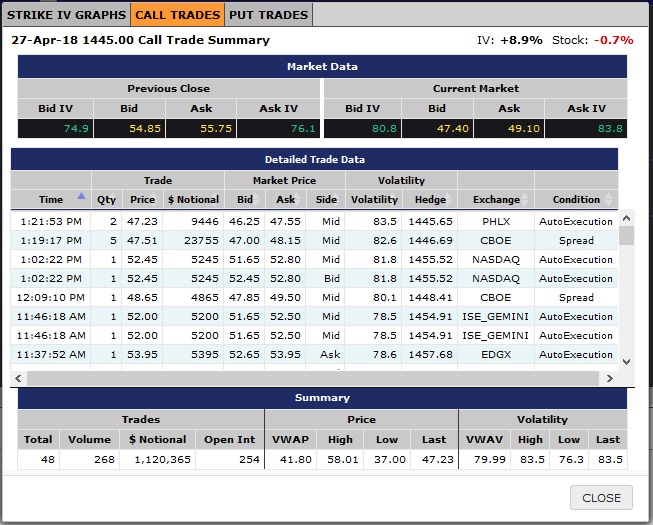
Clicking on a value in the "Volume" column brings up a detail screen that shows the trade details for that specific contract. More on this below...
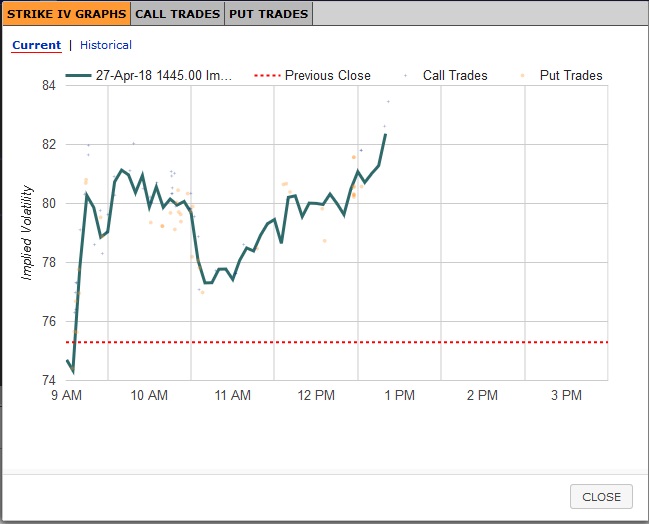
Clicking on a value in the "Strike" column brings up a detail screen that shows the implied volatility graphs for that strike. More on this below...

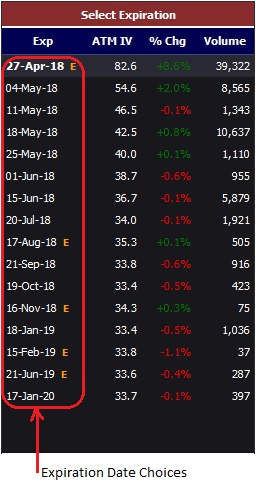
The table on the right side allows the user to select a different expiration which will cause the option chain table to be re-drawn for another expiration. To the right of the expiration date there may appear the letter "E" indicating upcoming earnings or "D" indicating upcoming dividends. Hovering over the "E" or "D" brings up details about the event.

Clicking on a value in the cell of one of the Volume columns (call or put) in the Option Chain brings up a screen showing trades and trade summaries for the contract associated with the selected expiration, strike and root. Click "Close" on the lower-right corner to close it.

Clicking on a value in the cell of the Strike column in the Option Chain brings up a screen showing trades and trade summaries for the contract associated with the selected expiration, strike and root. Click "Close" on the lower-right corner to close it.