Site Features

Symbol Links

Option Chain

Advanced Stock Chart

Historical Price Return Distribution Report

Forward-Looking Earnings Dates Report

Recent Dividend Announcements and Guidance Report

Future Ex-Dividend Dates Report

Option Repeat Trade Screener

Option Order Flow Sentiment Screener

Week-by-Week ATM Straddle Performance Report

Symbol ATM Straddle Performance

Seasonality Screener By Calendar Month

Seasonality Monitor By Calendar Month

Earnings Stock Pattern Screener

Earnings Option Strategy Screener

Event-Driven Historical Insights

At-the-Money Option Straddle Screener

Large Dollar Volume Burst Trades

Option Contract Analytics

Option Contract Historical Data Analytics

Option Contract Implied Volatility Chart

Option Contract Time And Sales

Option Contract Single-Leg Trades

Option Contract Multi-Leg Trades

Unusual Options Activty

How to use the earnings calendar

How do I cancel my subscription?

Glossary

Glossary

Financial Concepts

Stocks vs. Options

Dividends

Earnings

ETFs and ETNs

Bid-Ask Spread

Theoretical Edge

Relative Strength Performance

Stock Seasonality

Payout Diagrams

Option Delta Volume

Options Basics

Introduction

Brokerage Account

Option Chain

Open Interest

Delta

Gamma

Theta

Vega

Rho

Volatility

Skew

Cost of Carry

Option FAQs

Options Trading

Option Strategies Overview

Put Protection

Buy-Write

Synthetic Stock Positions

Delta Neutral Trading

Multi-Leg Option Trade Analyzer

Multi-Leg Option Trades Screener

Misc.

Stock Order Imbalance

Threshold List

How To

How to Trade Around Earnings

How to Find a Bull Call Spread for a Specific Stock

How to Use an Options Profit Calculator

How to Find a Stocks Historical Price Moves Around Earnings

How to Subscribe to Market Chameleon from Interactive Brokers

Implied Volatility Chart Overview for an Option Contract

Get an in-depth look at the implied volatility (IV) movements for a specific option throughout the trading day. The chart uses the midpoint IV of the bid and ask quotes, enabling you to track changes in IV and identify trends.

Learn about the implied volatility chart for an option contract

Key Insights:

  • Dotted Red Line: Displays the previous day’s IV close, offering a reference point to easily assess how the current day’s IV has changed.
  • Call & Put Trade Dots: Plots actual traded IV levels for calls and puts, allowing you to see how the traded IV compares to the midpoint IV. This visual highlights how trading activity can push IV to new levels throughout the day.

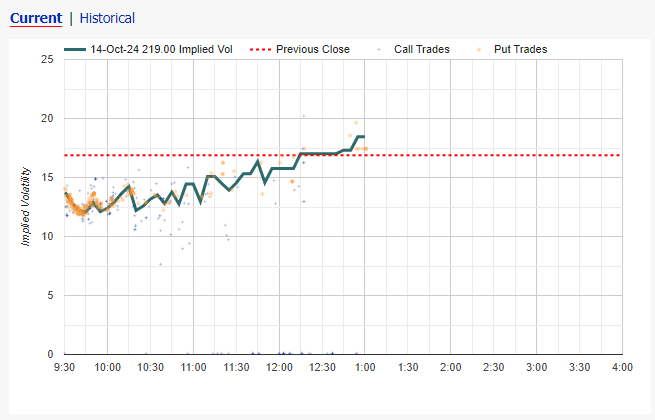
Additionally, you can switch to longer historical IV charts to view how this option's IV has evolved over time. This feature, combined with option volume trends, provides deeper insights into trading ranges, liquidity, and the dynamics of implied volatility across different periods.

This feature helps traders better understand the relationship between IV movements and trading activity, supporting more informed decision-making regarding price discovery, liquidity management, and assessing IV ranges for the option.

Market Data Delayed 15 Minutes