How do you find seasonality in stocks?
There are several ways to search for seasonality in stock prices and various time periods to analyze. Some of the most well known and discussed seasonal trends include:
- The Janurary Effect
- End of Quarter Effect
- Pre-Holiday Effect (Santa Claus Rally)
- Sell in May and Go Away (Until Halloween)
- Turn of Quarter
- The September Effect
However, for options traders, seasonality can be examined through time intervals measured up to the options expiration date. Take a look at the following example for a stock during a specific time period.
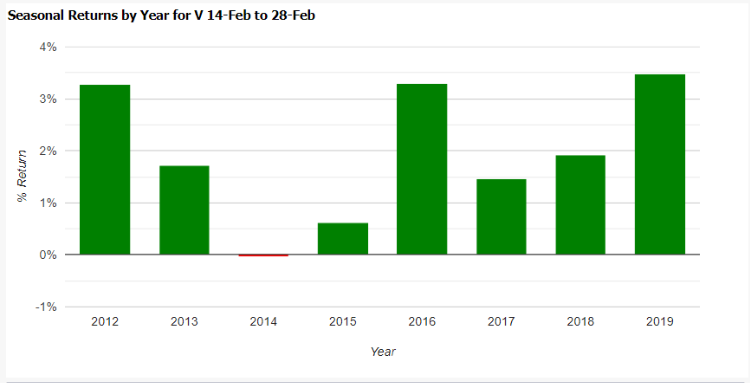
Lets say today is February 14th and we want to make a short term trade in the options market for Visa (V). We could look at options that expire on February 28th. The common seasonal trends
that we discussed above won't help us gain any kind of edge for this holding period. But, we can still analyze this specific time period (Feb 14th to Feb 28th) to see if there
has been any historical patterns over previous years. Looking at the screenshot below, we can see
that between the Feb 14th and Feb 28th has some consistent gains; up 88% of the time with an average return of 1.96%.
But remember, since history does not guarantee a future result, we use it as guidance in the absence of information to the contrary.
Of course, in a real life situation you would want a system that would first alert you to the stocks with
the best seasonal trends for the upcoming expiration. Then, as an options trader, you could use that information to have the system find the best
options strategy that meets your risk threshold while maximizing your profit potential.


