The Advanced Stock Chart is a really powerful tool for viewing stock price movement and technical analysis across a range of different timeframes, and comparing against several charting features. You can see a great deal of analysis for one symbol or compare a symbol against other symbols in the marketplace using a lookup feature.
To access the Advanced Stock Chart, direct yourself to a symbol page on the site by clicking the link for a symbol or by searching for the symbol in the top right hand box on the site. Then, on the left hand menu, you'll see a menu item for Stock Chart.
The Advanced Stock Chart has 5 main features, outside of the chart itself:
Timeframe Selection -- At the top of the page, you'll see a series of tab choices for timeframe, including 1-Day (1D), 5-Day (5D), 1-Month (1M), 3-Month (3M), 6-Month (6M), 1-Year (1Y), 3-Year (3Y), 5-Year (5Y) and 10-Year (10Y). For the long term charts, if we don't have enough data to fill the full length of time, we will just show what we have available.
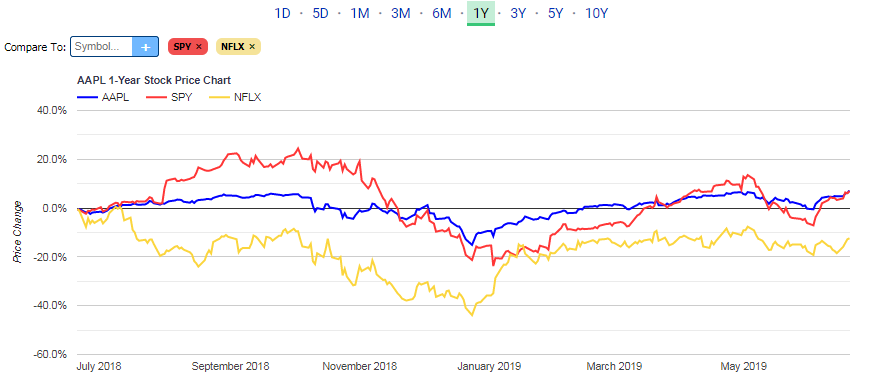
Symbol Compare -- To the top left of the chart, you'll see a box showing "Compare To: Symbol". Type a symbol into that box and hit the + sign or press enter to compare the price movement of your current symbol to another symbol in the market.
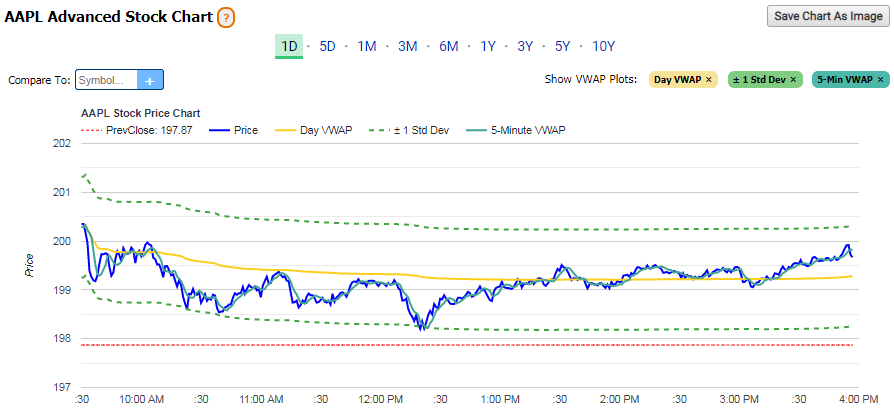
VWAP Plots -- for short-term periods (1-Day and 5-Day) you can see the price plotted against the Day's VWAP (progressive through the day) and a Support/Resistance band that is +/- 1 Standard Deviation around the VWAP. There's also a selection for a 5-minute VWAP. You can toggle the selections on/off based on the buttons to the top right of the chart.
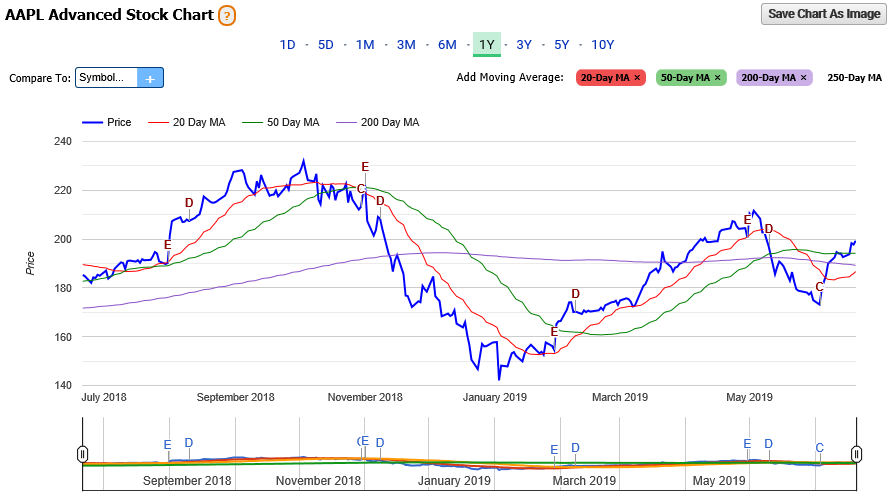
Moving Averages -- for longer-term periods (1-Month and up) you can plot the price against 20-day, 50-day, 200-day and 250-day moving averages.
Technical Chart -- at the bottom of the page is a chart with a drop-down to select a technical indicator to compare to the price chart. There are volume selections in 5-minute intervals for the short term and daily values for the long term, there's a 14-period Relative Strength Index (RSI), and there are Price versus Moving Average charts as well.
Volume-Weighted Average Price (VWAP) is a key value for traders to reference throughout the day. A lot of institutional trading -- from hedge funds and mutual funds that place large stock orders during the day -- peg the orders to the VWAP value, not to the current stock price. So knowing how far the price has drifted from the VWAP is valuable when you're about to place an order.
What we've done over time is track how close the stock's daily closing price is to the day's VWAP, and we use those historical observations to build a support/resistance range around the current VWAP, indicating where we're expecting the stock price to hover. It can be very important for future trading to visualize how quickly the stock price moves back towards the VWAP once it breaks through those bands, which is why the charting on this page is helpful. If there are sharp gains or losses that don't have a lot of volume behind them, often times the stock price will bounce back towards the middle once more trading activity picks up.
The below is a screenshot of a sample 1-day chart with VWAP selections.

The below is a screenshot of a sample 1-day technical chart with total volume selected, but a drop down showing the possible choices.

The below is a screenshot of a sample 1-year price chart with moving average plots selected.

The below is a screenshot of a sample 1-year price chart comparing the movement of Apple (AAPL) against SPY and Netflix (NFLX).
