The goal of the Earnings Stock Pattern Screener is to allow users to find consistent patterns in stock trading activity around earnings releases, over the course of the last 3 years. Search through stocks to see if there are notable trends in the stock price movement either before or after earnings -- choose from 13 different timeframes around the earnings release.
The screener is listed under the Earnings menu item at the top of the screen, where it says For Premium Users.
The report lists all symbols that have released quarterly earnings and the change in stock price during various timeframes around those earnings. We track the changes in price for all of those timeframes over the last 12 earnings (if available), and compile the statistics into this screener for you to sort, filter, and search.
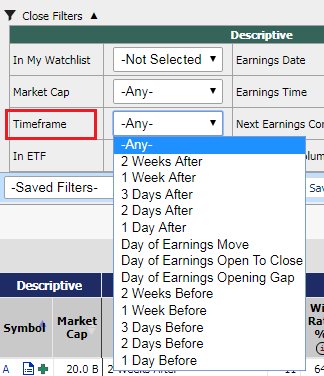
At the top of the page you'll see the Filters, most of which correspond to the result statistics in the table. The other filters are descriptive, like In My Watchlist, which selects only those symbols listed in your Custom Watchlists, or In ETF, which selects only those stocks which are currently listed as holdings in selected popular market ETFs (like SPY, DIA and QQQ).
The screenshot below shows a sample of the filters available:

For the purposes of this report, the Day of Earnings Trading is considered to be the day immediately following the release of the earnings. So, if a stock were to release earnings on Monday morning before the open (BMO), then Monday would be the day of earnings trading (and similarly, Friday would be the day before earnings trading).
If a stock releases earnings results Monday after the close, then Tuesday would be considered the day of earnings trading, and Monday would be the day before earnings.

Before Timeframe Choices: You can select any of 2 Weeks Before, 1 Week Before, 3 Days Before, 2 Days Before, or 1 Day Before earnings. The change in stock price would go from the start of that timeframe to the close immediately before earnings.
Day of Earnings Move: This is referred to as the "Earnings Move" or "Earnings Effect" -- simply the change in stock price from the close immediately before earnings to the close immediately after earnings. If a stock releases earnings Tuesday Before Market Open, for example, this would be the change in stock price from Monday Close to Tuesday Close.
Day of Earnings Opening Gap: This is the opening gap or opening "jump" immediately following the release of earnings, from the previous day's closing price to the opening price the day of earnings. Often, the stock will experience large movements right at the open as traders are reacting to the news of the earnings release.
Day of Earnings Open to Close: This is the "drift" in stock price from the open on the day of earnings to the close on that same day. Sometimes, when the stock experiences a significant opening gap, it will drift back the opposite direction during the day -- kind of like a correction to a market overreaction.
After Timeframe Choices: You can select any of 1 Day After, 2 Days After, 3 Days After, 1 Week After, or 2 Weeks After earnings. The change in stock price would go from the close on the day of earnings trading to the end of the selected timeframe.
An example: if symbol ABCD announces earnings on Thursday May 10th, after the market close, then the day of earnings trading would be Friday May 11th, the next day. Selecting a timeframe of 3 Days Before would mean you're seeing the change in stock price from the close on Monday May 7th to the close on Thursday May 10th. If you select 1 Week After, you'd see the change in stock price from the close Friday May 11th to the close Friday May 18th.
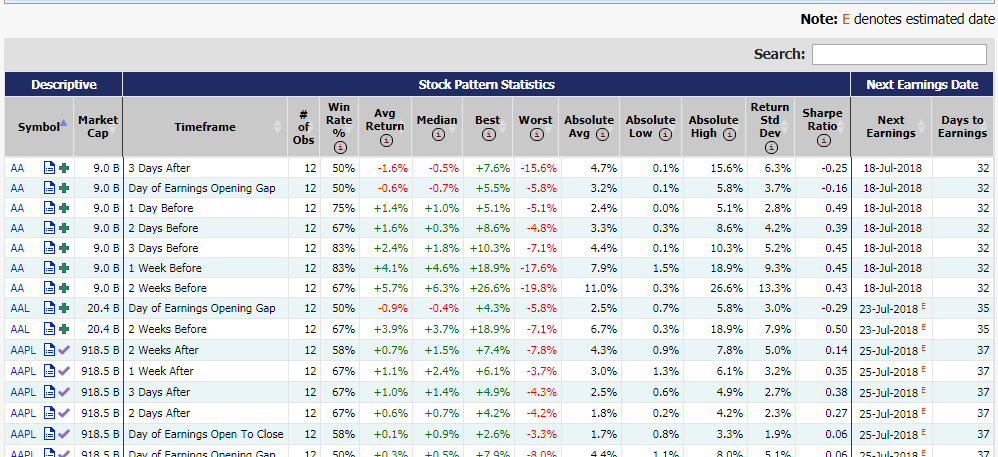
The results table is loaded with information. Here's a quick rundown of the results available -- many of which are filterable.
Here's a screenshot of a sample result set from this screener:
