Site Features

Symbol Links

Option Chain

Advanced Stock Chart

Historical Price Return Distribution Report

Forward-Looking Earnings Dates Report

Recent Dividend Announcements and Guidance Report

Future Ex-Dividend Dates Report

Option Repeat Trade Screener

Option Order Flow Sentiment Screener

Week-by-Week ATM Straddle Performance Report

Symbol ATM Straddle Performance

Seasonality Screener By Calendar Month

Seasonality Monitor By Calendar Month

Earnings Stock Pattern Screener

Earnings Option Strategy Screener

Event-Driven Historical Insights

At-the-Money Option Straddle Screener

Large Dollar Volume Burst Trades

Option Contract Analytics

Option Contract Historical Data Analytics

Option Contract Implied Volatility Chart

Option Contract Time And Sales

Option Contract Single-Leg Trades

Option Contract Multi-Leg Trades

Unusual Options Activty

How to use the earnings calendar

How do I cancel my subscription?

Event-Driven Historical Price Effects

In several places throughout the site, we use a feature called Event-Driven Historical Insights to analyze trading before, during, and after notable market events. The goal is to see if there are detectable patterns in historical trading for either the stock price or certain option strategies, to help our users make better decisions about upcoming market events.

Jump to: Single-Symbol Analysis | Stock Pattern Screener

Event Types

We've collected the events into four different event-type categories:

1. Price-Driven Events

  • 12 Largest One-Day Gains are the 12 single days with the largest positive price changes within the last 3 years
  • 12 Largest One-Day Losses are the 12 single days with the largest negative price changes within the last 3 years
  • 12 Largest Positive Opening Gaps are the 12 days with the largest positive opening gap changes (day's open price vs. previous closing price) within the last 3 years
  • 12 Largest Negative Opening Gaps are the 12 days with the largest negative opening gap changes (day's open price vs. previous closing price) within the last 3 years

2. Corporate-Driven Events

  • Ex-Dividend Dates: the last 12 ex-dividend dates for the stock within the last 3 years, if it pays dividends
  • Company Events: any notable company events that have happened in the last 3 years, like shareholders meetings, conferences, or presentations

3. Market Economic Events

  • Federal Reserve FOMC Meetings: the Federal Reserve's Open Market Committee meets regularly to make decisions on interest rates and makes announcements on whether there will be changes to the federal rates
  • GDP Report: announcements of the lastest gross domestic product figure
  • Consumer Price Index: report of the lastest change in price paid for a basket of consumer goods
  • Retail Sales: a monthly report of retail merchandise sold to consumers
  • Employment Situation: a monthly report from the US Department of Labor on changes in non-farm payroll employment
  • Jobless Claims: a weekly count of the number of people filing to receive unemployment benefits
  • PMI Manufacturing Index: a monthly report on manufacturing production and inventory
  • EIA Petroleum Status Report: a weekly report on crude oil production, imports, balances and pricing
  • New Home Sales: a monthly report compiled by the US Census Bureau on the sale of newly-built family homes
  • Existing Home Sales: a monthly report on the sales of existing family homes
  • Housing Starts: a monthly report on the construction of new privately-owned housing

4. Exchange Holidays

This includes New Year's Day, Christmas Day, and the US federal holidays Thanksgiving, Memorial Day, Fourth of July, and Labor Day.

Explaining the Timeframes

Before Timeframe Choices: You can view any of 2 Weeks Before, 1 Week Before, 3 Days Before, 2 Days Before, or 1 Day Before the selected event. The change in stock price would go from the start of that timeframe to the close immediately before the event day.

Full Day Move: The change in price from the closing price before the event to the closing price on the day of the event.

Day of Event Opening Gap: This is the opening gap or opening "jump" on the morning of the selected event, from the previous day's closing price to the opening price the day of the event.

Day of Event Open to Close: This is the "drift" in stock price from the open on the day of the event to the close on that same day. Sometimes, when the stock experiences a significant opening gap, it will drift back the opposite direction during the day -- kind of like a correction to a market overreaction.

After Timeframe Choices: You can view any of 1 Day After, 2 Days After, 3 Days After, 1 Week After, or 2 Weeks After the event. The change in stock price would go from the close on the day of the event to the end of the selected timeframe.

Note on Holidays: the markets are closed on exchange holidays, so we don't calculate full-day moves, opening gaps, or drifts open-to-close.

Single-Symbol Analysis

You can find a thorough analysis on the event driven insights for one symbol by visiting the report under each symbol's overview page. The menu item is on the left hand side under Tools.

There, you'll be able to view results for both Stock Price Performance and Trends and Option Values and Strategy Performance.

A screenshot of the selection for the Event Insights Analysis for one symbol

Stock Pattern Screener

In addition to analysis for one symbol, you can view the stock price patterns as a screener, where you can compare results for all the stocks and timeframes we have available. Note: because the data set is so large, the Event-Driven Stock Pattern Screener is currently limited to only those stocks with an average daily stock volume of over 50,000 shares.
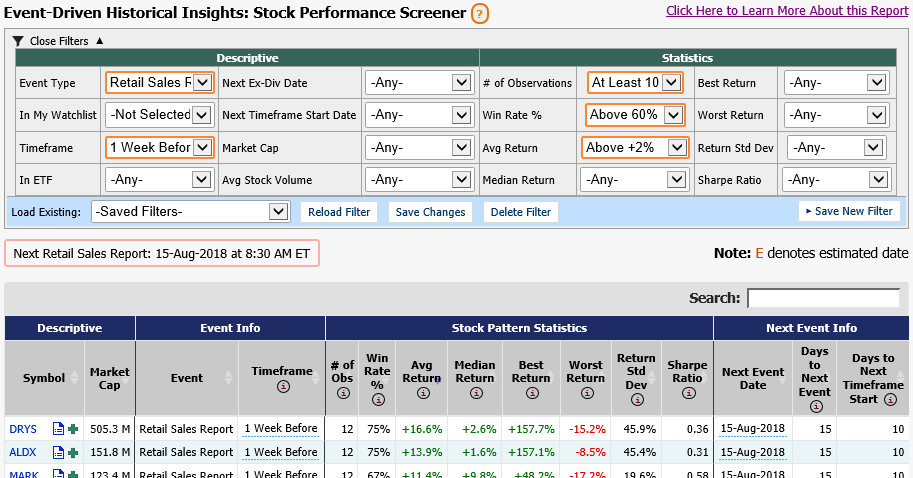
Using Filters

A screenshot of the filters available for the Event-Driven Insights Stock Pattern Screener

At the top of the page you'll see the Filters, most of which correspond to the result statistics in the table. The other filters are descriptive, like In My Watchlist, which selects only those symbols listed in your Custom Watchlists, or In ETF, which selects only those stocks which are currently listed as holdings in selected popular market ETFs (like SPY, DIA and QQQ).

Use Event Type to select the specific event you're looking to analyze, like Federal Reserve FOMC Meetings, Ex-Dividend Dates, or an exchange holiday. Then use Timeframe to narrow in on the relative timeframe, like 1 Week Before the event, or the Day of Opening Gap, or 2 Days After the event.

Explaining the Results

The Event Info columns show you the designated event type and the timeframe for this result. The Next Event Info columns show you the date of the next occurrence of the designated event, as well as the number of trading days until that date. Hovering over the Next Event Date column might show you some more information on the expected event. A date marked with an orange "E" is estimated -- we use this when we haven't received confirmation of the exact date or time.

The rest of the columns explain the result set, and can help you figure out the stocks that have had the best performance for the selected event type and timeframe.

  • # of Observations is the number of occurrences for this event type and this timeframe where we have found applicable data for this stock patterns analysis.
  • Win Rate % is the number of times, out of those observations, that the stock price gained value over the specified timeframe.
  • Avg Return is the average percentage return for the stock price over the specified timeframe.
  • Median Return is the median percentage return for the stock over the specified timeframe. Using the median return can help counteract average returns that are skewed by 1 or 2 extreme results.
  • Best Return is the best return, percentage-wise, for that symbol over the specified timeframe. If all the returns are negative, the best return would be the negative value of the lowest magnitude.
  • Worst Return is the worst return, percentage-wise, for that symbol over the specified timeframe. If all the returns are positive, the worst return would be the lowest positive return.
  • Return Std Dev is the standard deviation of all the percentage returns within the observation set.
  • Sharpe Ratio is a figure which represents the average return divided by the standard deviation. A high, positive Sharpe Ratio would be considered to be a positive indicator -- high average returns with low standard deviations.
  • Next Event Date is the date of the next occurrence for the selected event (economic report, ex-dividend, holiday). If the date is estimated, there will be a small "E" next to the date.
  • Days to Next Event is the number of business days until that next event date, if the date is confirmed.
  • Days to Next Timeframe Start is the number of business days until the start of the selected timeframe for that next event date. If the next GDP Report is in 20 days, and you're looking at 2 days before, this number would be 18 days.

Here's a screenshot of a sample result set from this screener:
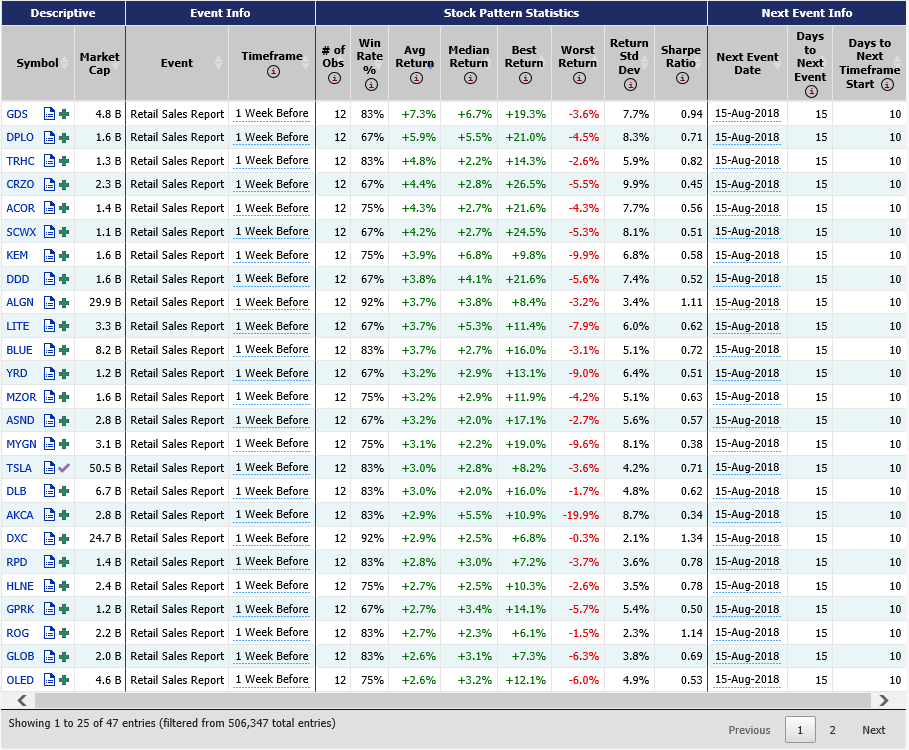
A screenshot of sample results for the Event-Driven Insights Stock Pattern Screener